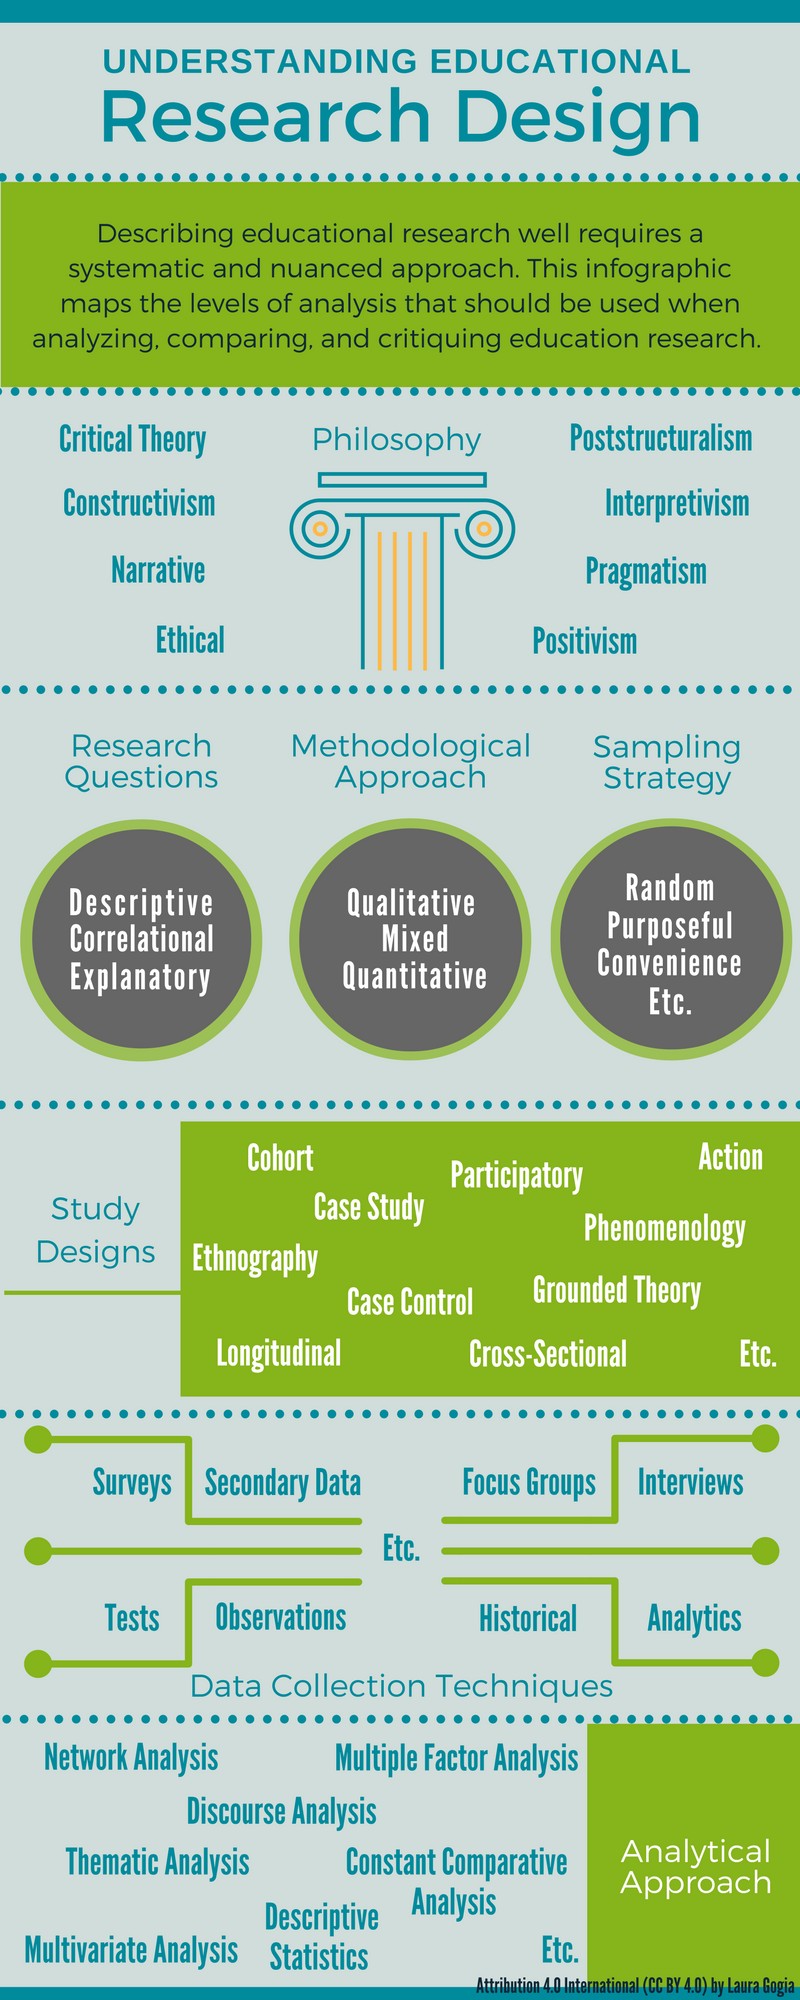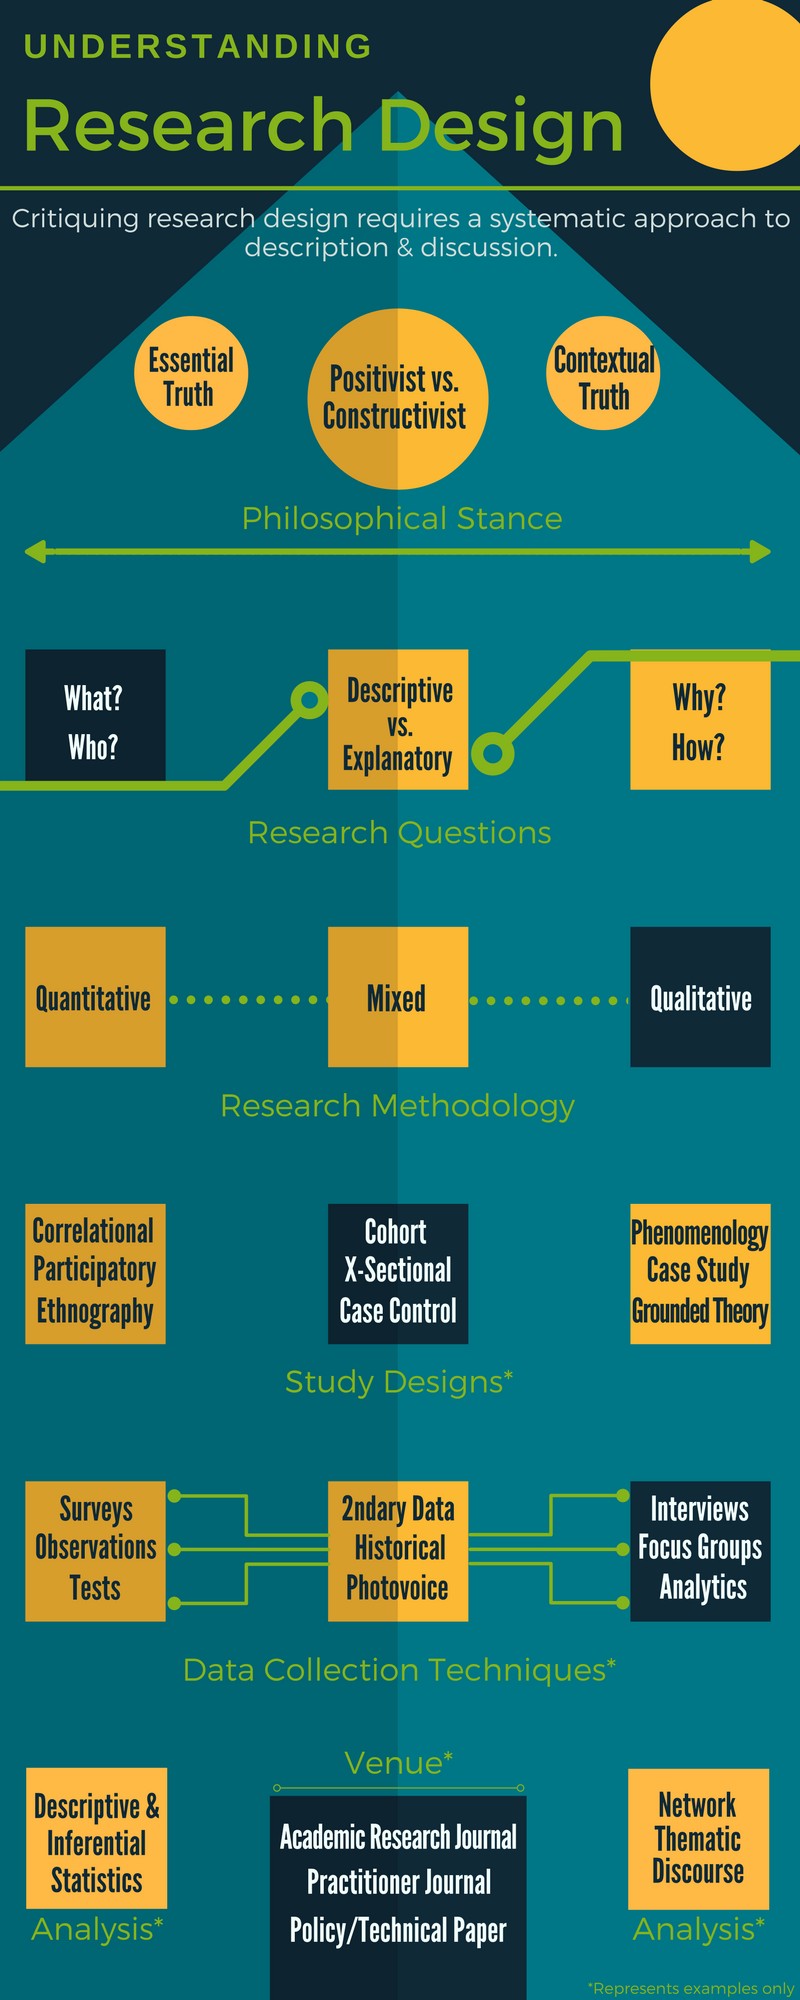
Edit 11/21/16 *for those of you just reading this on 11/21/16 or later, I’ve been working on another draft via Twitter with much help from everyone but especially Maha Bali. I’ll be putting out another, bigger better blog post. When I do, I’ll link it <here.>
Edit 11/22/16 But until the bigger better blog post comes out, I’ve added version 2.0 below version 1.0.
–LG
Since moving on from my postdoctoral fellowship I’ve been doing some educational research and development consulting. I’ve noticed a trend in some of the work I’ve been offered. People tend to bring me on to projects (paid and unpaid) for one of two reasons. First, I am usually a good bet to be a wildcard – if you want a different perspective or someone to blow audience/stakeholder expectations out of the water, I can do that sometimes.
Second, I have experience in synthesizing large amounts of information, leading me to a lot of work reading, organizing, analyzing, and critiquing entire fields and bodies of educational research. A lot of my work will be coming out in conference presentations, blog posts, and publications soon. However, through this process I’ve discovered that a lot of people have difficulties understanding how to describe research in terms of its underlying assumptions, design, and methods. This is a problem, because educational research is so decentralized and generally messed up that a systematic approach is essential to making sense of any of it. Making sense of something and being able to communicate what you’ve found is essential to critique and reform…which, in my opinion, the educational research desperately needs.
Therefore, I made an infographic to describe how I think about organizing research literature. It’s an infographic and not a power point slide or a set of bullet points because I’m trying to develop my infographic skills. Would love to hear your thoughts.