All posts by @GoogleGuacamole

Dissertating in the Open (Visual Article Series)

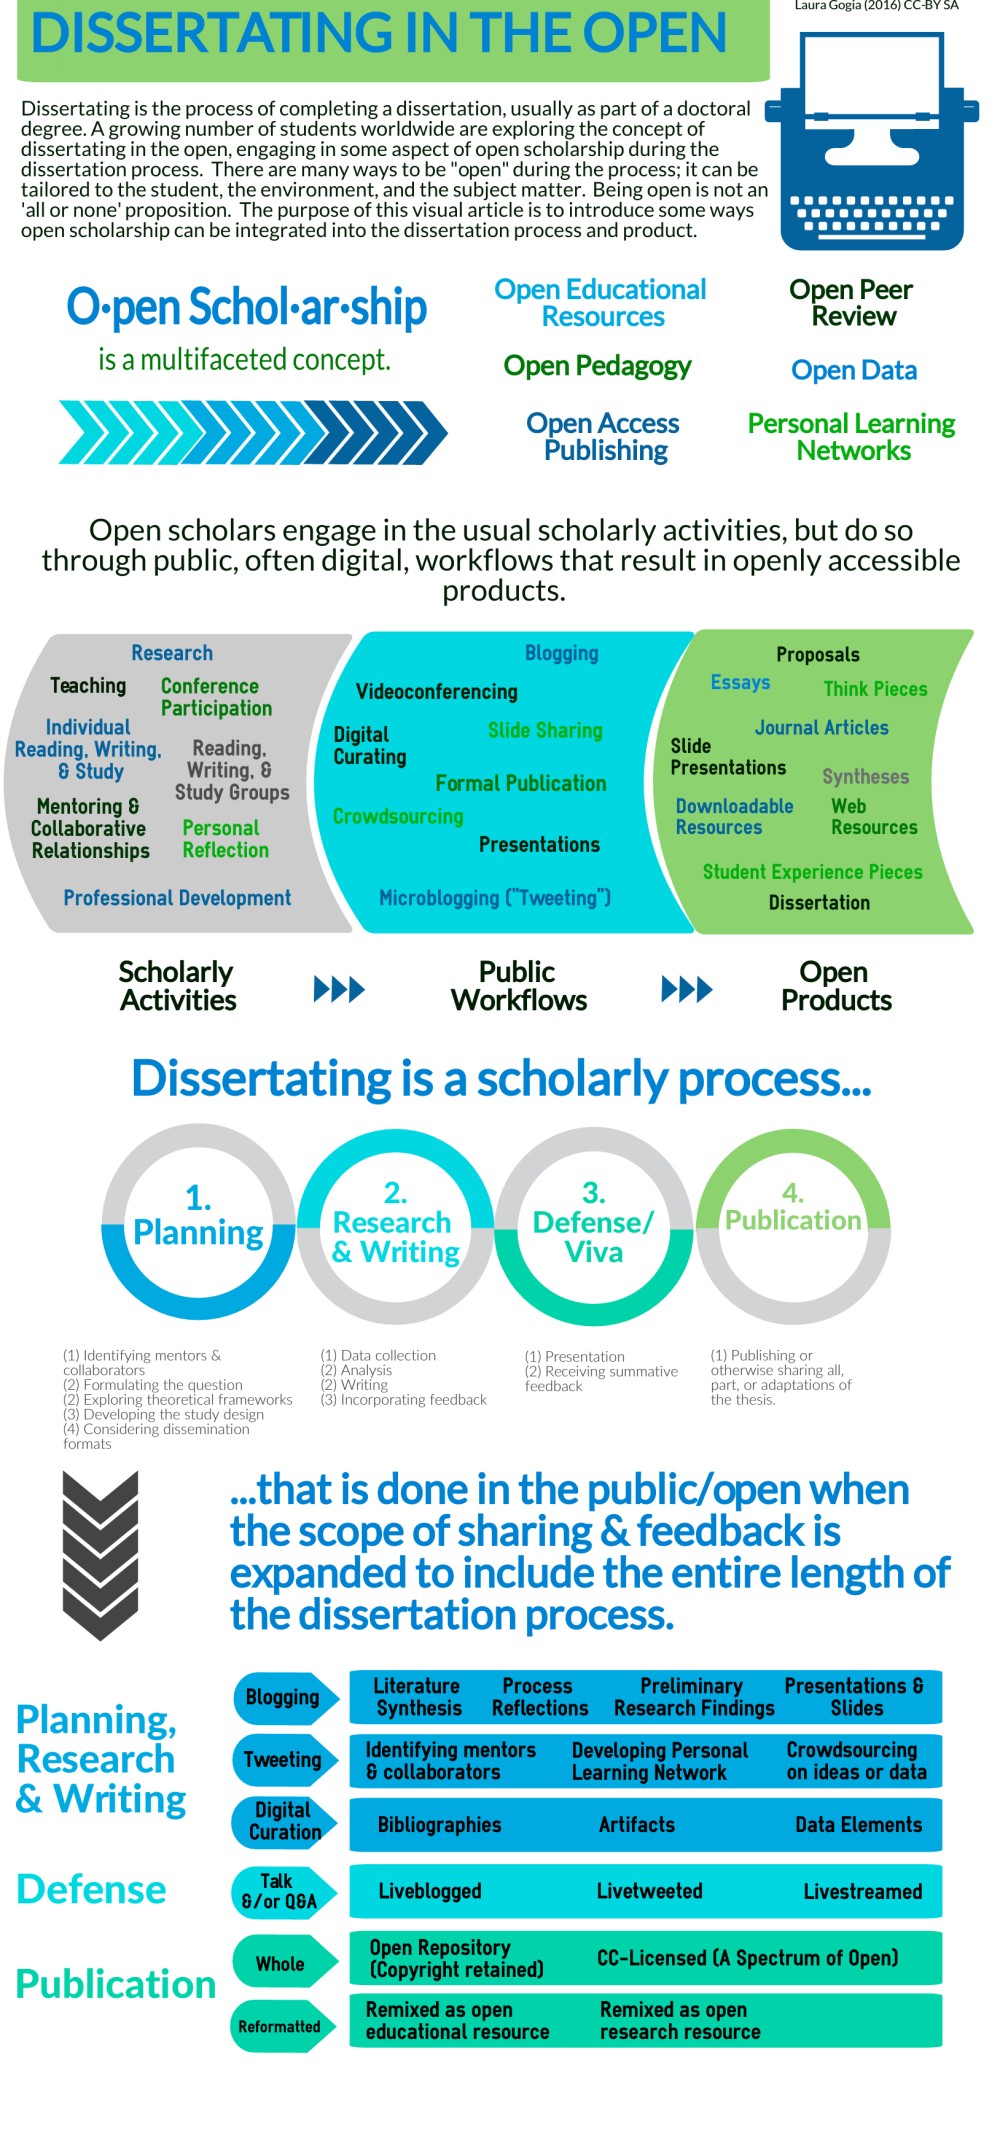
To continue my series of visual articles on educational research, I have branched out (or perhaps come home) to the act of dissertating in the open. The following is meant to introduce the idea – to show the overlap and points of potential integration between open scholarship and the process of planning, implementing, and publishing a dissertation.

Much of what follows is inspired by the writings of Catherine Cronin and George Veletsianos  and Royce Kimmons, conversations with Bonnie Stewart, Maha Bali, Virtually Connecting, and #OpenEd2016, and my own work with Jon Becker and Alec Couros.   Special thanks again to Maha Bali and Tod Massa who reviewed this and offered their comments.

This is not meant to introduce the idea of open dissertations completely. There are additional things to be said and places to go. This is a part one.

Dissertating In The Open PDF

dissertatingintheopen-6

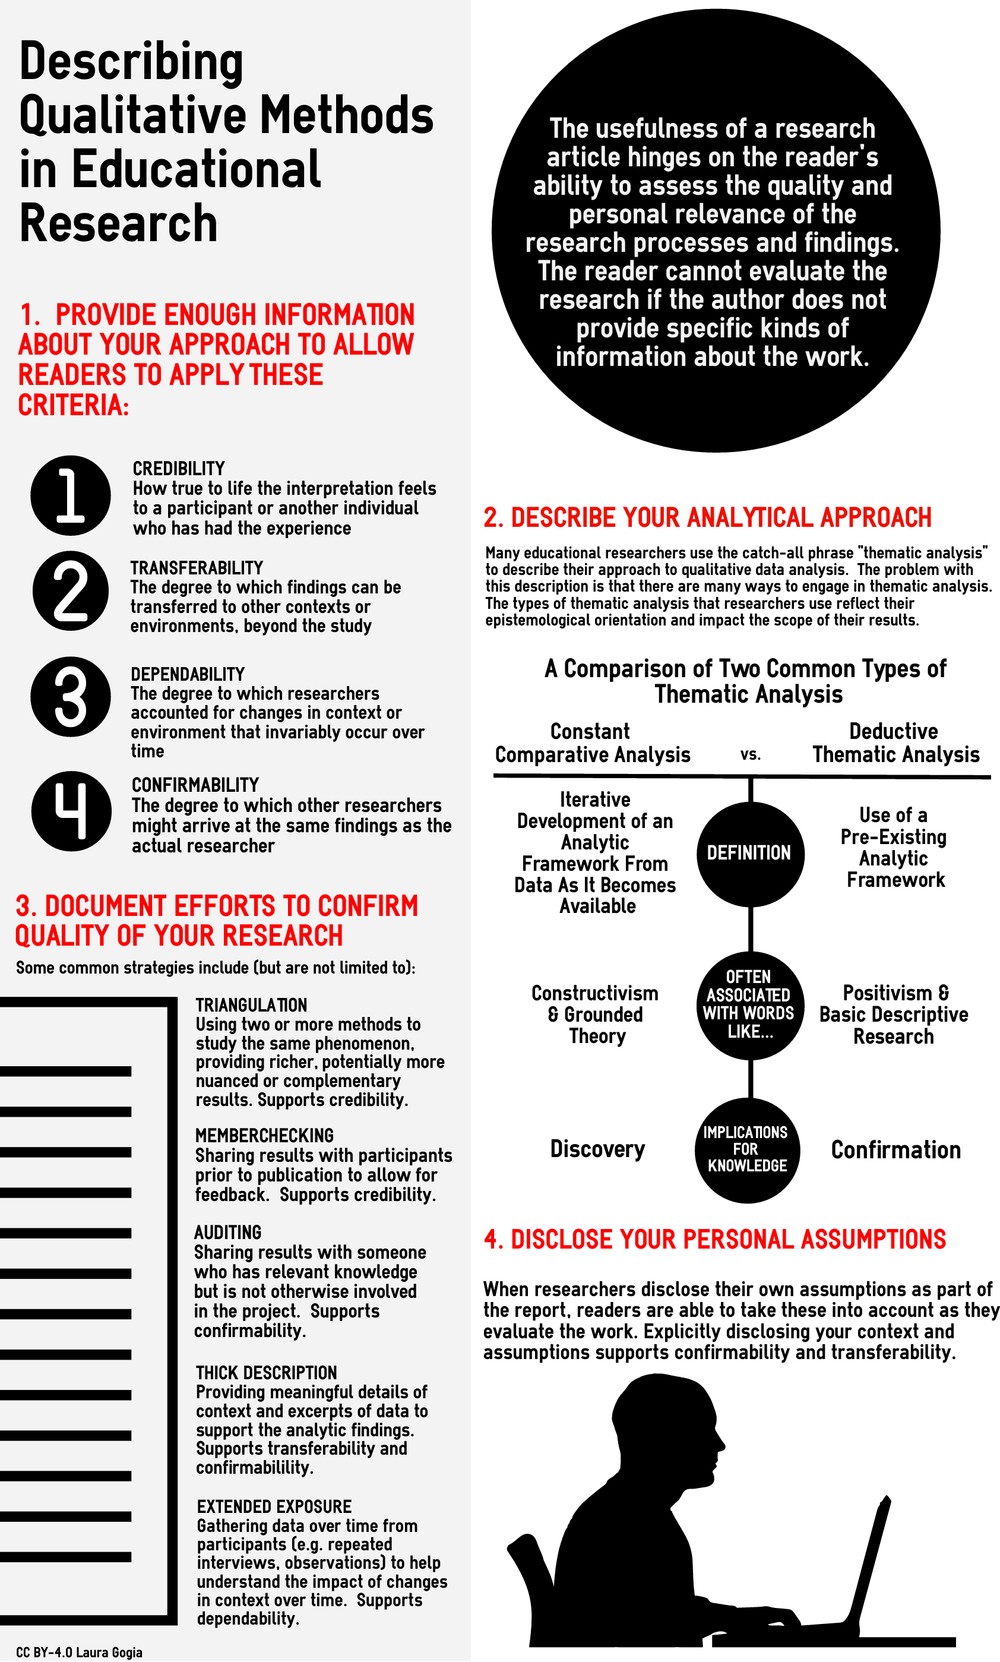
Describing Qualitative Methods in Educational Research: The Annotated Infographic

As I described in my last post, Understanding Educational Research and Design, I have spent a significant amount of the last year reading and evaluating the educational research literature for its structure, themes, and methods. I found problems; too many articles lacked epistemological framing, glossed over faulty sampling and data collection, provided minimal information on analytical processes, and failed to advance the literature in any meaningful way.  As this concerns me in terms of the future of educational research, I have started to develop a collection of downloadable, CC-licensed visual articles that address some of the issues I found in the literature.

One of the qualities I enjoy about educational research is its strong tradition of using qualitative, quantitative, and mixed study designs. However, too often I found articles that described qualitative data collection without information about participants or the collection process, qualitative findings without information on the analytic processes, or qualitative collection processes without information on analysis or findings.   It was difficult to tell if the problems lie in the study design and implementation or whether these were shortcuts made in writing and reporting.

When researchers take short cuts in reporting research processes – qualitative or quantitative – they inevitably and irreparably devalue the work.  The usefulness of a research article hinges on the reader’s ability to assess the quality and personal relevance of the research.  The reader cannot evaluate the research if the author does not provide specific kinds of information about the work.

The following visual article reviews some of the critical methodological pieces that must make it into a research article (regardless of prescribed word counts), if a reader is to be able to make meaning of the work.  While I have presented my argument through a lens of qualitative methodologies, at least one Twitter follower suggested that it was relevant to all research, regardless of methodological tradition.  I tend to agree with him, but will be creating one specific to a quantitative lens soon. Also, a shout-out to all the Twitter followers who reviewed this visual article before I published it here. Special thanks go to Margy MacMillan and Chelsea O’Brien for their detailed feedback.  Also, thanks to my friend and SCHEV colleague Tod Massa for looking at this about a dozen times over the last week and finally telling me today that it might be okay.


Downloadable PDFevaluatingqualitativeresearch-1

  1. For more information on criteria for quality in quantitative research:

Lincoln, Y. S. (1995). Emerging criteria for quality in qualitative and interpretive research. Qualitative Inquiry, 1(3), 275-289.

Mays, N., & Pope, C. (2000). Assessing quality in qualitative research. British Medical Journal, 320 (7226), 50.

Trochim, W. (2006). Qualitative Validity. Research Methods Knowledge Base

2.  For more information on thematic analysis:

Charmaz, K. (2003). Grounded theory. Qualitative psychology: A practical guide to research methods, 81-110.

Fereday, J., & Muir-Cochrane, E. (2006). Demonstrating rigor using thematic analysis: A hybrid approach of inductive and deductive coding and theme development. International journal of qualitative methods, 5(1), 80-92.

Strauss, A., & Corbin, J. (1994). Grounded theory methodology. Handbook of Qualitative Research, 17, 273-285.

Vaismoradi, M., Turunen, H., & Bondas, T. (2013). Content analysis and thematic analysis: Implications for conducting a qualitative descriptive study. Nursing & health sciences, 15(3), 398-405.

3.  For more information on qualitative research methods and strategies (general):

Bogdan, R., & Biklen, S. K. (1997). Qualitative research for education. Boston: Allyn & Bacon.

Lincoln, Y. S., & Guba, E. G. (1985). Naturalistic inquiry (Vol. 75). Sage.

Strauss, A., & Corbin, J. (1998). Basics of qualitative research: Techniques and procedures for developing grounded theory . Sage Publications, Inc.


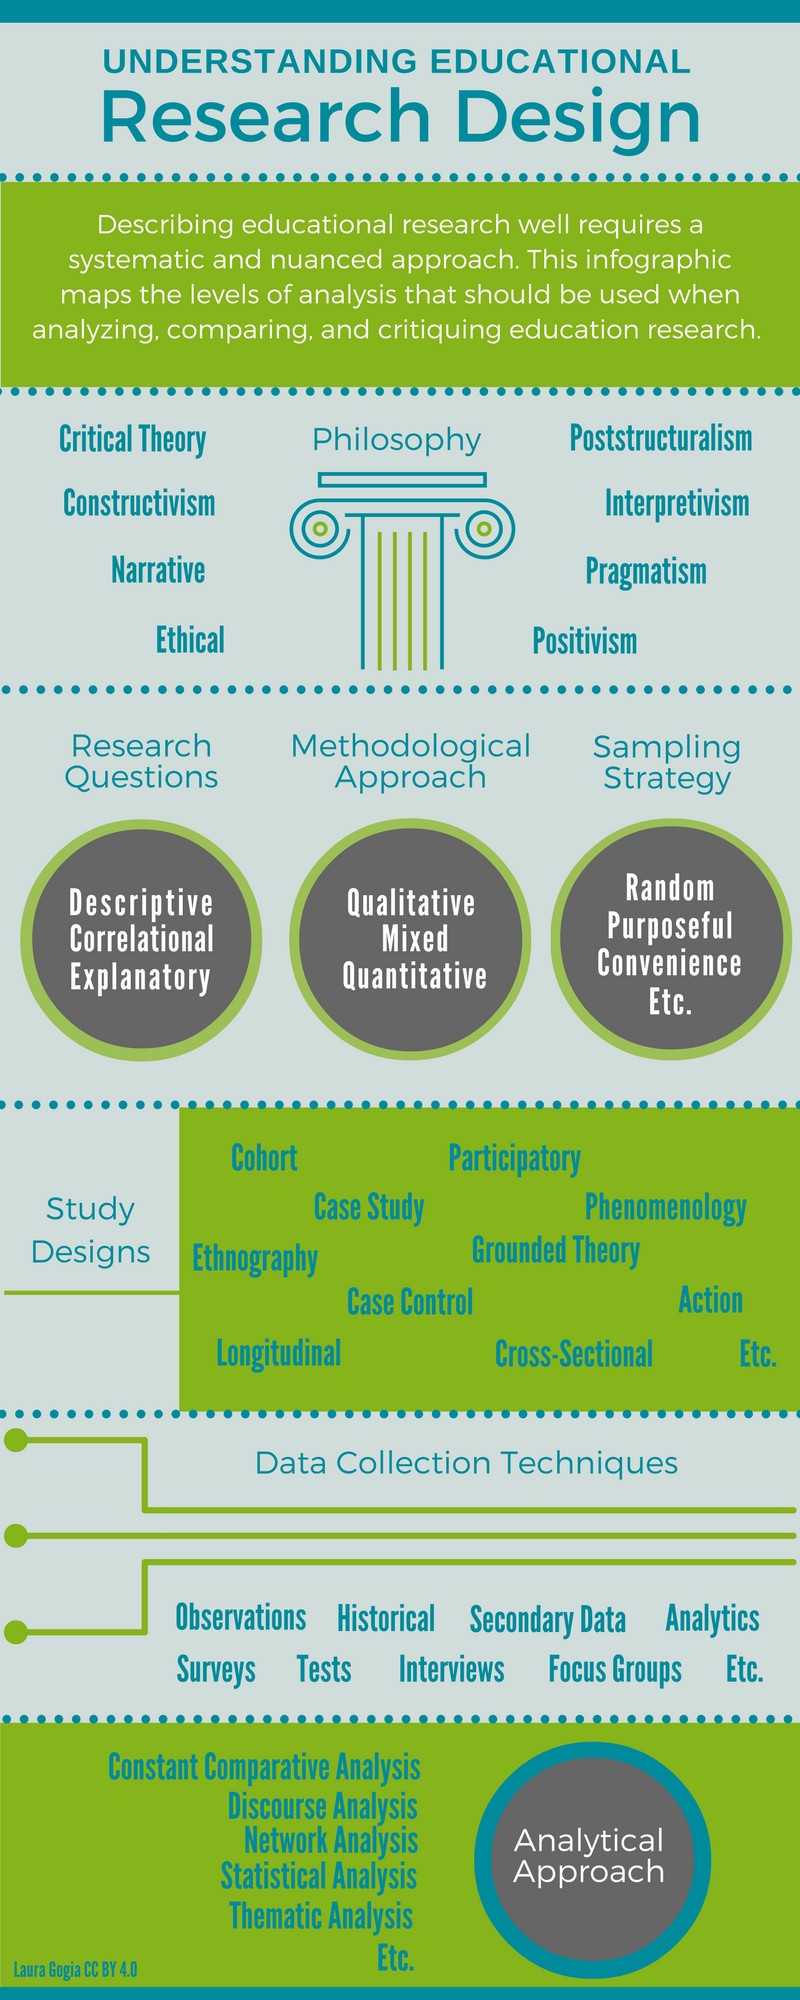
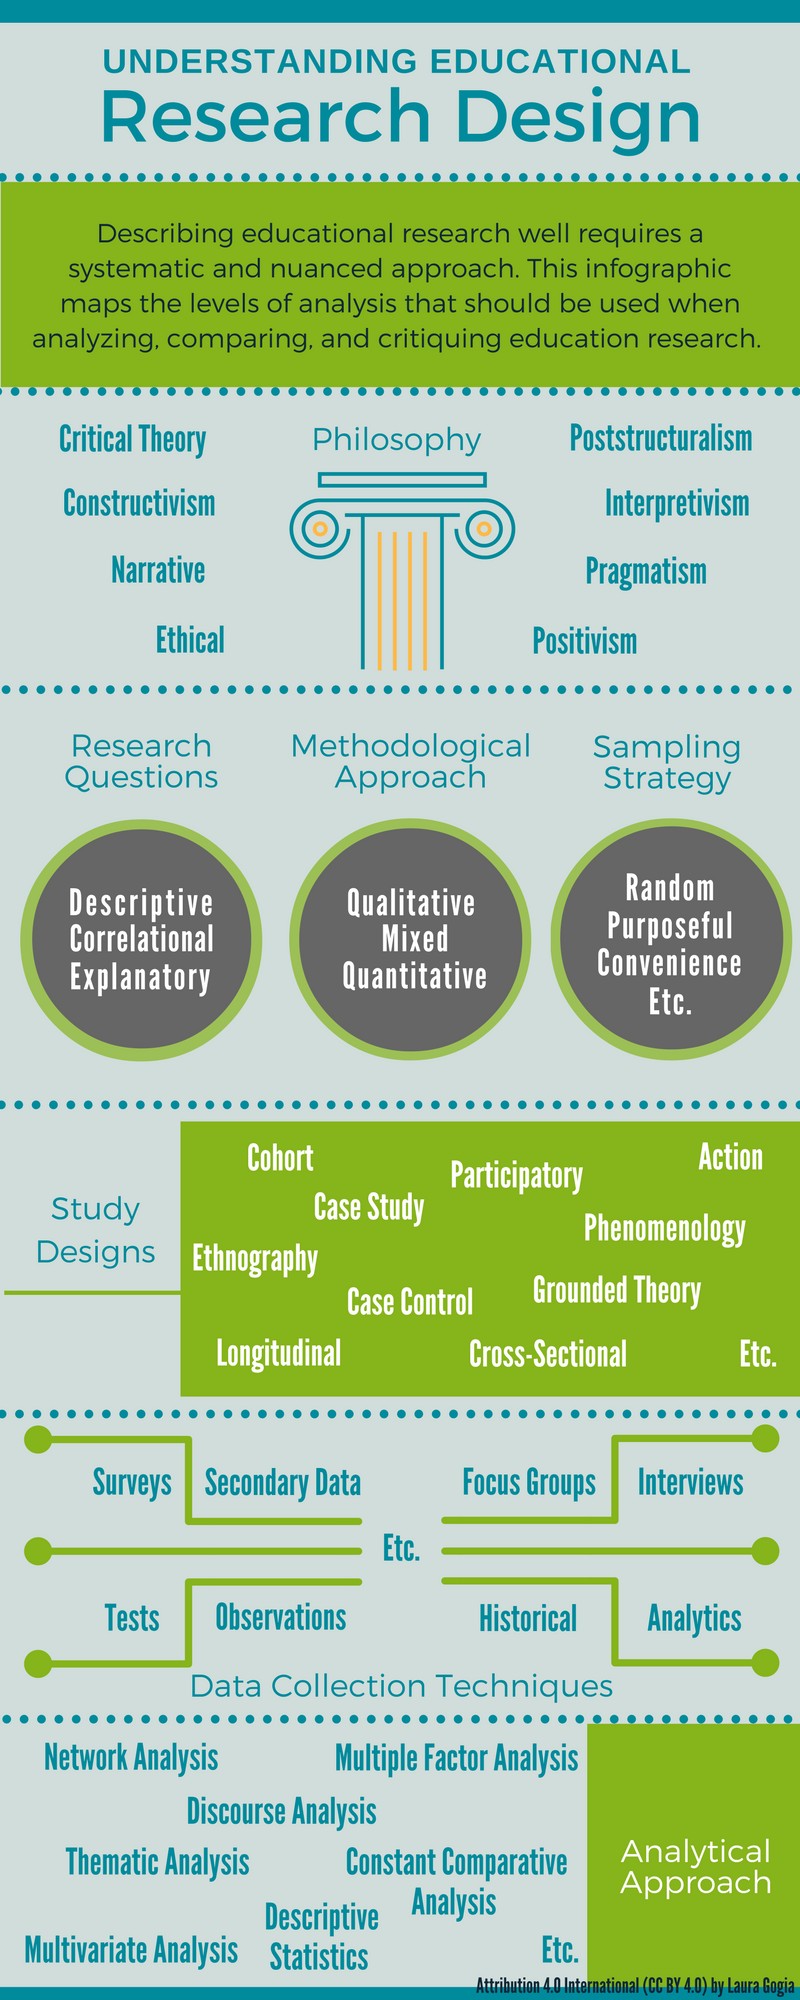
Understanding Educational Research Design: The Infographic

I. 

This infographic represents a love letter, from me to the educational research community at large.  Over the last year, I have engaged in two large, systematic literature reviews, designed an educational research instrument, co-written an educational research grant, and completed and defended my dissertation research in educational research and evaluation.  These projects have not been limited to one field; rather, they have spanned subdisciplines (e.g. library, social media, student engagement), sectors (e.g. K-12, adult, higher education), stances (e.g. policy, psychology, teaching and learning) and funding structures (e.g. academic, professional, and independent).

I have been brought onto several of these projects as a methodologist. My role was to describe and critique the approaches and methods used by researchers within these different educational research communities.  In this capacity, I have reviewed approximately 800 educational research articles this summer alone. What I have found is systematically alarming, but it is a story that will unfold through a series of published articles, conference presentations, and blog posts over the next year. This blog post and downloadable infographic marks a starting point for the story.

II.

In engaging with colleagues, authors, students, and casual readers of educational research literature, I have discovered that many people have a narrow perspective on how to talk about published research.  Oftentimes, their discussion stops and starts with the terms “Qualitative,” “Quantitative,” or “Mixed Methods.”  Alternatively, it will start with data collection techniques: “This is a survey” or “The authors did a bunch of interviews” are common ways to describe work.

The problem with this approach is that it ignores the fundamental truth that an author’s philosophical stance (critical, constructivist, postpositivist, etc) will impact every other aspect of their work.  As my friend Maha Bali has argued, positivists and constructivists can both produce qualitative research, but it will have very different flavors to it. To call something “qualitative” is not enough to describe exactly what it is.

Furthermore, the pathway from constructivist to qualitative to data collection (think interviews) and analytic methods (think thematic coding) is not automatic and cannot be assumed. Some interviews are almost as prescriptive as questionnaires while others are free-flowing. Observations can yield qualitative or quantitative data. Thematic analysis can be inductive or deductive, emerging or compliant with a pre-existing framework.

All of this is to say that we must think and talk bigger than data collection and analytic methods when we describe research. If we fail to identify the underlying philosophies and assumptions of the work, we fail to understand the shortcomings, biases, and strengths inherent to it. We fail to ask the right questions and grasp the bigger picture.

Downloadable PDF

describing-research-design-2

III.

Every research design textbook I have ever read includes a single sentence: “Research questions drive the design, not the other way around.” This is true of good research. Therefore, when trying to describe the quality of a corpus of research literature, it behooves us to look to the nature of the questions being asked.  Are they focused on describing the nature of what is? How things relate? What causes what?

Paying attention to these things is essential for critiquing the structure of the individual study, but there’s more – Identifying trends in research questions can tell you a lot about the field itself.  For example, young or rapidly changing fields need to establish what is before they can move to why things happen.  Funders need to learn to value strong descriptive research in these areas. However, a continued reliance on descriptive designs in the presence of previously established understanding suggests something may be broken in terms of the scholarship being performed, maybe a systematic lack of funding or support, vision or strategy, researcher understanding or training.  Further investigation is warranted.

The point: Research questions matter.  Pay attention.

IV. 

Obviously, research methodology matters as well.  Qualitative, quantitative, and mixed methodologies have definitions and criteria and support specific research frameworks or study designs. There are textbooks.  There are articles.  There are classes. There are teachers. There are methodologists who can help others do these things well when they don’t have an interest in learning it themselves.

I bring this up because of a tweeted conversation I had with my former dissertation advisor, Jon Becker, earlier today.  He let me know – probably just to irk me, because this will always work – that he was peer reviewing an article that had self-identified as “mixed methods” because it had included one open-ended question on the end of a quantitative survey.

I doubt that Creswell and Plano Clark would approve any more than I did.

I trust Jon to be an impenetrable wall against this sort of behavior, but unfortunately Jon does not peer review every educational research article.  Let me say this loudly:

The widespread sloppy or ignorant handling of the “mixed methods” or “qualitative” labels within the educational research literature is shocking.  When critiquing articles or a body of literature as a whole, it is essential for all of us to question how authors are using these labels. Are they accurate?  And if they aren’t accurate, what can we surmise about why or how they are being used?

  • Can you really perform an “in-depth qualitative case study” based on the findings of one quantitative survey (true story; no)
  • Can you report out a proper phenomenology or ethnography without a single quote or rich description of participant context (true story; no and no)
  • Should you be able to read over 100 self-identified qualitative studies without a single reference to memberchecking or auditing? (true story; no)
  • Can you claim mixed methods with just one open-ended question on the end of a survey (true story; no)
  • Should you publish a paper on the basis of a single focus group conversation (30 minutes) with an n of three? (true story; no)
  • Why did these examples get through peer- and editorial review? And what are we going to do about it? 

V.

Therefore, I offer up this infographic as a place to start a conversation: a conversation with students, researchers, publishers, peer-reviewers, and ourselves. It is not comprehensive. It is not an expert piece (although it has gone through a form of peer-review on Twitter, led by the marvelous Maha Bali herself).  However, this infographic serves as a reminder of the following facts:

The misuse of methods is rampant and labels are not to be blindly trusted.

Research questions tell a story oftentimes bigger than the article itself.

Data collection and analytic tools can be used in different ways by different research traditions to produce very different outcomes.

Philosophy shapes everything.


Been Wanting to Do This for a While

Edit 11/21/16 *for those of you just reading this on 11/21/16 or later, I’ve been working on another draft via Twitter with much help from everyone but especially Maha Bali.  I’ll be putting out another, bigger better blog post.  When I do, I’ll link it <here.>

Edit 11/22/16 But until the bigger better blog post comes out, I’ve added version 2.0 below version 1.0.

–LG

Since moving on from my postdoctoral fellowship I’ve been doing some educational research and development consulting. I’ve noticed a trend in some of the work I’ve been offered. People tend to bring me on to projects (paid and unpaid) for one of two reasons. First, I am usually a good bet to be a wildcard – if you want a different perspective or someone to blow audience/stakeholder expectations out of the water, I can do that sometimes.

Second, I have experience in synthesizing large amounts of information, leading me to a lot of work reading, organizing, analyzing, and critiquing entire fields and bodies of educational research.  A lot of my work will be coming out in conference presentations, blog posts, and publications soon.  However, through this process I’ve discovered that a lot of people have difficulties understanding how to describe research in terms of its underlying assumptions, design, and methods.  This is a problem, because educational research is so decentralized and generally messed up that a systematic approach is essential to making sense of any of it.  Making sense of something and being able to communicate what you’ve found is essential to critique and reform…which, in my opinion, the educational research desperately needs.

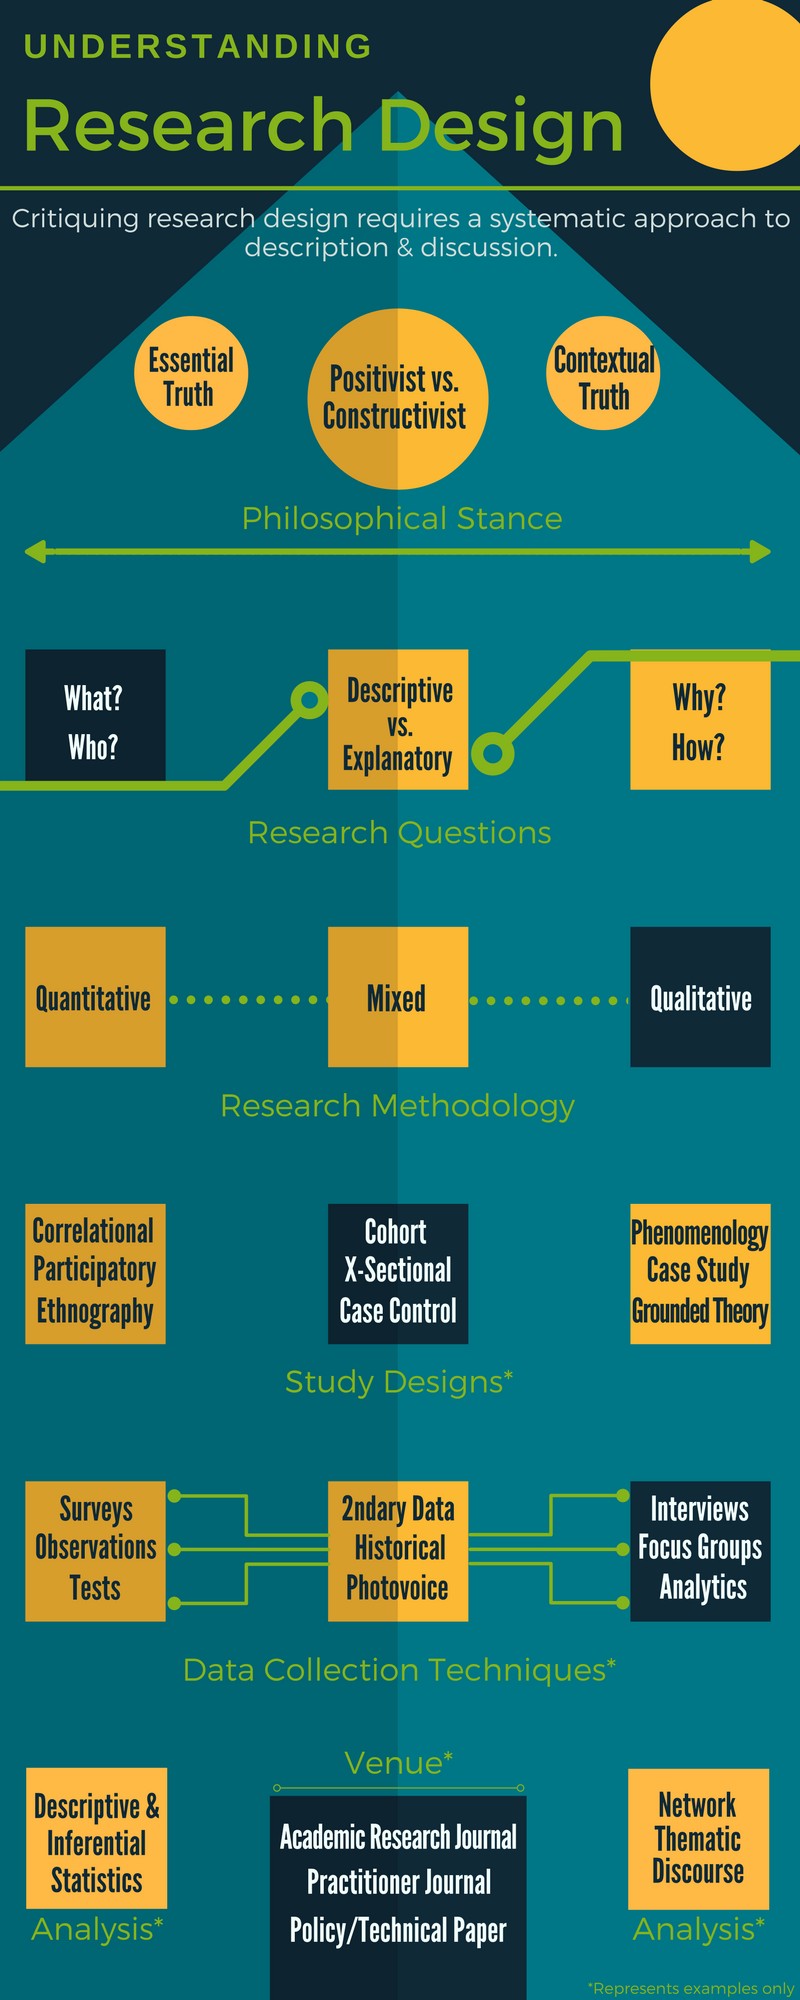
Therefore, I made an infographic to describe how I think about organizing research literature.  It’s an infographic and not a power point slide or a set of bullet points because I’m trying to develop my infographic skills. Would love to hear your thoughts.

Describing Research Design.png

 describing-research-design

Stories as a Way of Being

This morning at #OpenEd16, I presented as part of a panel on “Floating on a Sea of Data: Why Higher Ed Needs #SoNAR. I was a last minute addition, joining  Kate Bowles, Kristen Eshleman, Bonnie Stewart, Dave Cormier, and Amy Collier when another panelist became unavailable.  The position was offered to me as an opportunity related to my recent collaboration with Kristen on using Sensemaker. “Yes” was the obvious answer, even I had never heard of #SoNAR and my formal experience in narrative inquiry was fairly scant.

I sat quietly in the first planning session listening to the others. As they spoke, I looked for holes in their expertise (there were none) and ways in which I was different from them (there were plenty), as a means to understand how I might best contribute.

At first, I couldn’t find an answer, but around the same time a friend of mine sent me a collection of vignettes and journal entries that he had written in the aftermath of an life-altering event.  More than any philosophical conversation, his work reminded me of the power of stories as a way of being in the world: a way of remembering, understanding, and healing.

In reading his stories, I remembered that I had written my own in the year after I left medical practice, a collection of ten essays that I felt captured the essence of my medical education and practice experience. And as I considered his stories and how they related to mine, I realized what I could contribute to the conversation at #OpenEd16: a story of my own, one that might be as powerful for the audience as my friend’s had been for me.

Today I shared the tenth story of my collection in a Peroscoped conference session and in front of a packed audience. The aim was to set the stage for Kate, Kristen, Bonnie, Dave, and Amy to discuss the need to harness narrative inquiry for systemic change. However, this was also an opportunity for me to be more open and honest about who I am. It was an opportunity to be brave.

Only one other person had ever read these stories before today.  Sharing this part of my life with other people in ways that are complicated, half-written, and raw has never been a priority for me, in part because I have been afraid that people would not understand. Even the “good” stories seemed too risky to share. Maybe I wouldn’t be believed. Maybe I would be accused of being arrogant if I showed myself in too good a light. Maybe people would find bad things in my story where I had originally thought there was good.

Today, I made a decision to trust the OpenEd community.  When you asked if you could Periscope the session, I said yes because I trusted you to take care of me if things went wrong. You have supported me through my dissertation, professional trials, and bouts of self-doubt and despair. You are my professional family, and this conference is my home. If I were going to share these things anywhere, it would be at OpenEd, with you.

The sharing was not easy. If you watch the video, you’ll hear that I almost stopped before I started.  You’ll hear how slow I was because it was hard to get the words out.  You’ll hear me speed up as you laughed and responded in ways that made things easier. You’ll hear me finish, grieving all over again at the end of the story, but satisfied that I had said everything that needed to be said.

I am so grateful to all of you.

—

Transcript

Stories are a way of being in the world, with other people. I am here to offer an example.  As many of you know, I used to be a gynecologist practicing alone in a small remote hospital in Virginia.  For a lot of reasons, I burned out and left medical practice.  But in the year after that happened, I wrote down ten stories that I felt captured the essence of my experience as a medical student, resident, and physician.  I wrote down these stories so that I could remember, try to understand what had happened, and to begin to heal.

This is Chapter 10 pretty much as I wrote it five years ago.

My last four months were some of the busiest of my career, but I had looked up from the work just long enough to notice that it was springtime in the countryside. I was counting down the days by this point.  On the tenth day before my last, I was enjoying my pre-dawn commute through the country when I saw Andy’s (pseudonym) text come across my phone: “Laura. Please tell me you are already here.”

Andy was a former chiropractor, now rural ER doc, and my only friend in the Emergency Department. I immediately picked up speed and called him back. A woman in labor with her second child was lying in the trauma bay. I only had to observe one set of contractions to know she was moving from latent to active labor right before my eyes.

Active labor is notoriously unpredictable in second babies. It could take thirty minutes, two hours, or stall out altogether. My little rural hospital did not technically offer obstetrical care so it had minimal obstetrical equipment available for me to use. In this particular case, the lack of equipment it put me in a very tight spot. I was a trained and board certified obstetrician as well as a gynecologist and could be held accountable regardless of access to equipment; I had to make the decision on whether to transport her to another hospital and risk her delivering en route or keep her at this hospital, which was unprepared for a laboring woman who wasn’t in act of giving birth.

I will be honest: I cannot remember what this woman looked like or what her name was, but I remember every part of her story.  Her midwife, whom she loved, was over an hour away in the city. The diversion to my hospital had been about policy, not about her choice. And I could feel this: This woman felt very much alone.

I knew the roads between my town and the city well. I knew the woods, the deep isolation, the very spotty cell service. I knew there would be no help for us if we got in trouble along the way. But as I felt the rhythm of her labor, my instincts told me that we could make it if we left immediately with the right sort of drivers.  The woman and I considered the options briefly. We made the decision together, as best as we knew how.

I walked out of the trauma bay to eyeball the drivers, because I was only going to try this if I thought they would drive with a special sort of passion. One was a tall skinny kid with two large earrings. The other was only slightly older, with a serious neck tattoo.  In other words, they looked perfect to me.  I literally held my hands over my heart as I asked them to drive me and the woman as fast as they could.

There was something hypnotic about that ride. Without access to drugs or monitors there was nothing doctor-like for me to do. I had nothing to offer but myself and the confidence of another woman who had given birth before. The woman and I sat in silence, holding hands, her eyes closed. The drivers rarely used the sirens as they moved over the empty roads. The rush of the wind and the rocking motion of the rig only heightened the feeling of acceptance that wrapped me up together with this woman. I watched the sun rise over the tiny fields that marked the edges of the forest.

With a definite air of victory, the drivers turned on the sirens as we burst onto the city’s morning traffic.  The sun was fully up. The woman sensed the change and opened her eyes between contractions, which were now only one minute apart. I smiled and looked down at her, announcing – only when I was absolutely sure – that this baby would be born in the hospital. I asked her if the baby had a name. She looked at me but only had time to smile before another contraction began.

Reaching Labor and Delivery was anticlimactic. The midwife met us at the elevator doors. We transferred the woman to the hospital bed, stopped for fresh linens and coffee, and like all good EMTs, slipped away unnoticed.

The drivers sat up front, and I rode home alone in the back of the rig, ripping a Styrofoam cup into bits on the cold, vibrating metal floor.  My phone buzzed in my pocket and it was a text from the midwife. She had wanted me to know of the delivery – a baby girl. Baby Serenity had been born 20 minutes after we had arrived at the hospital. Both mom and baby were fine.

The rig rattled enough that the drivers in the front couldn’t hear me so I let myself l cry and laugh and cry a little more. The baby’s name was Serenity and she had done her job. I had just traversed the riskiest scenario that I ever would in my medical career and it had never occurred to me to be afraid. It had been an ending and a beginning, both simple and good, a true journey through the woods that the woman and I had both gotten through.

An exercise in simple data visualization

Data visualization.  It’s a buzzword we hear frequently, usually in connection to other buzzwords like big data, business intelligence, dashboards, and accountability.  However, data visualization doesn’t have to be a buzzword.  As a concept, it can be quite simple: it is the act of collecting information and displaying it in ways that illuminate while allowing for informed decision making.  Data visualization does not have to be fancy to be effective; in fact, simple is often better. Even the simplest forms of data visualization can drive conversation and change.

slide02
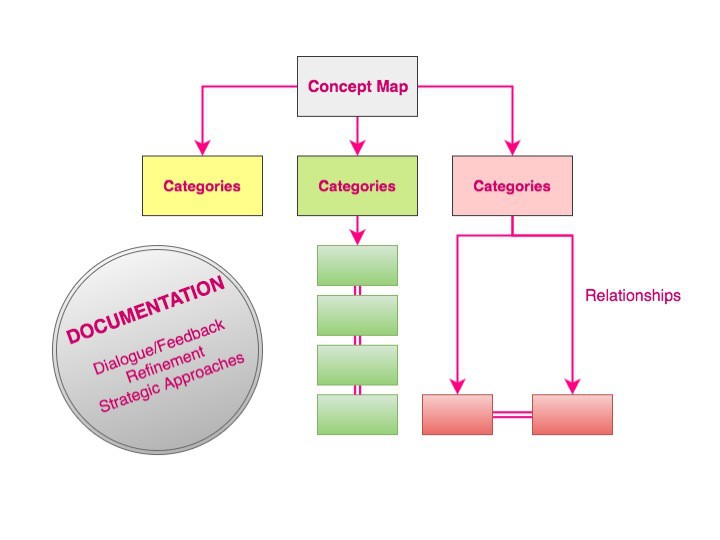
A concept map.

A concept map is a form of data viz that educational researchers have shown since the 1970s to be an effective way to help people grasp complex concepts. According to the research, concept maps work in several ways.

  • First, concept maps encourage us to organize pieces of information into categories – which in turn allows us to move to a more abstract level of thinking.
  • Second, they make thinking visible or concrete – which makes the thinking less fuzzy to the person who is trying to think it.
  • Third, concept maps themselves act as “meeting posts:” places that allow other people to meet our thinking where we are, facilitating conversation and potential collaboration.
  • Finally, concept maps allow us to maintain a record over time, so that we can reflect on where we were, where we are, and where we might want to go in the future.

And the best thing about concept mapping is that it can be adapted to be useful in many contexts for facilitating discussion and enabling change.

Let’s work through an example in which we use a simple form of data visualization – concept mapping – to reflect on and discuss our behaviors in digital spaces as a potential form of professional development.

slide05

1.Take ten seconds to write down as many answers to this question as possible.  Where do you go when you are online?  Which platforms, digital spaces, applications – anything you do online – personal or professional.

Go ahead. I’ll wait.

My guess is that you had no problems writing down a handful – search engines, email accounts, entertainment services like Netflix and Spotify, social media (Facebook, maybe Twitter, Instagram).  The creatives among you may have some video, music, photo, or graphic design applications on the list – things that help you remix or create things.

2.Circle the ones you use for work or your professional development. 

slide06

3. Identify five ways that you used those digital platforms or spaces.  What sorts of activities were you engaging in? What was your purpose in being there?

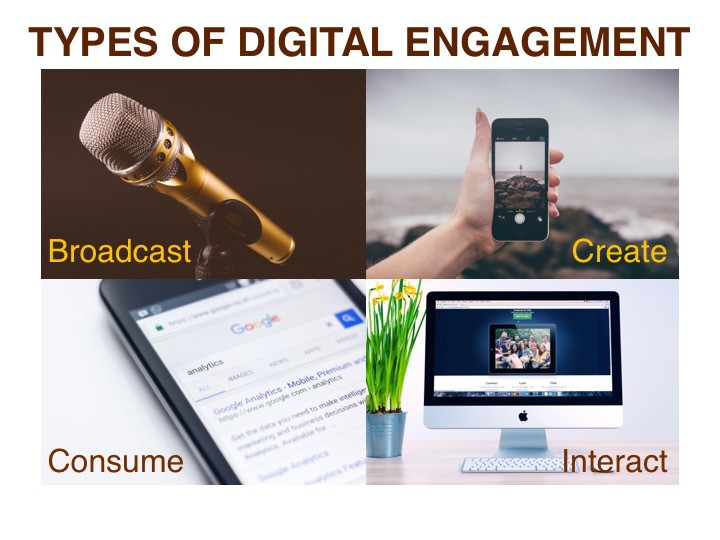
Generally speaking, when people get on the Internet, much of what they do  can be described through four categories of engagement.  These are not necessarily mutually exclusive or a comprehensive list, but they are a way to begin to think about and talk about what you do on the web.

  •  Broadcasting.  People express their ideas and information with no real intention of dialogue, per se.  Broadcasting is about getting one’s ideas out there for someone else’s consumption.
  • So obviously if there are some people broadcasting, there are others who are consuming. We consume when we don’t have the intention of giving a lot of feedback – we consume information when we search databases or search engines.  We consume entertainment when we watch Netflix. When we buy things on Amazon.
  • However, sometimes people can actively participate or interact and provide feedback – we consume when we buy on Amazon, but we are participating or interacting when we opt to leave a review.  We are consuming when we read a Wikipedia entry, we are interacting or participating when we make edits.  We interact when we engage in dialogue on Facebook or Twitter; we are contributing to a larger narrative.
  • Finally, sometimes we use the web to create, and I’m thinking about all the web applications that allow us to make things. Making videos, music playlists, picture mashups, editing software, photo albums.

slide07

Like I said, these activities aren’t mutually exclusive – sometimes we make things collaboratively, for example.  And certainly they can be used in a sequential fashion – in fact, I’m going to give you an example of that in a minute.  But I find that these categories can be useful when we are talking about what we are doing on the Internet.

4. So, now that we have a little bit of a vocabulary how can we leverage these spaces and our behaviors to advance our professional development?   I want you to take a moment to choose how you are going to frame this question for your own purposes.  Are you going to think about your students’ professional development?  Your team’s?  Your own?  All of those would work for the activity that’s coming up – pick the one that interests you the most.

There are plenty of answers to that question, but the one I’d like for us to consider is the idea of a personal learning network, which is a form of strategic digital engagement that fosters, learning, sharing, and professional networking in ways that potentially transcends institutions, geography, and traditional power hierarchies.

So, how do professional learning networks work? I’m going to offer a personal example.

5. As I tell this story, I want you to look for the digital spaces, the types of digital engagement, and how things fit together. 

slide10

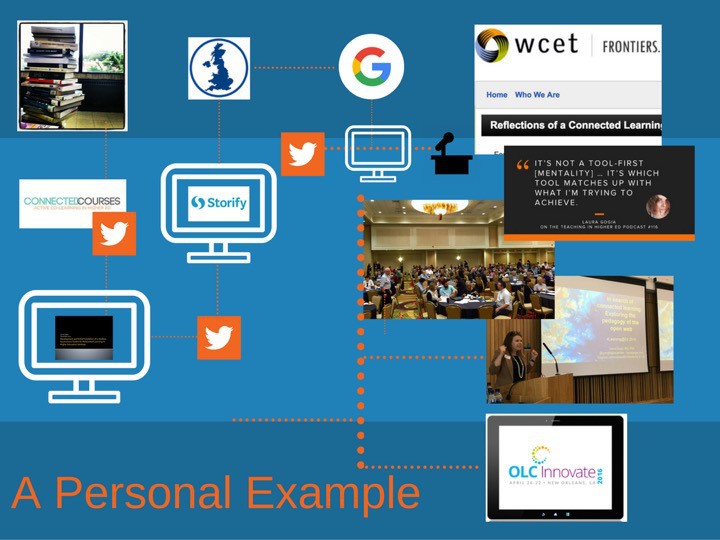
In the fall of 2014, as part of my graduate fellowship, I participated in a massively open online course (MOOC) on faculty development and connected learning. Through my Twitter interactions related to that course, I became recognized in within the connected learning community as someone who researched connected learning as part of my dissertation work.  Around that same time, I was developing and presenting a mock prospectus for a dissertation preparation course.  I posted my mock prospectus slides on slide sharing platform and then embedded that presentation in a blog post in which I described my research proposal. I advertised my blog post on Twitter using the MOOC hashtag and asked the people from the course to take a look and offer feedback.

As they commented and asked me questions on Twitter, I noticed some themes across their responses.  I aggregated their tweets on Storify, which is a storytelling digital platform, and embedded the product into a blog post in which I suggested potential areas for research collaborations based on the questions they were asking.  I advertised that post on Twitter, using the MOOC hashtag. Several scholars expressed in interest in collaborating in different areas.  For the next 18 months I worked several research collaborations through combinations of Google Hangouts, Docs, and Google Plus.  This work led to conference proposals and publications at an international level. The combinations of online and conference presentations led to keynote and plenary addresses, guest blogging assignments, panels and podcast invitations, and  consulting work.

Can you identify two or three digital platforms and types of engagement from that story?

So I am not trying to suggest that everyone needs to develop a professional learning network as complex as my own, but what I am arguing is that there can be benefits from approaching digital engagement intentionally.  

How can we optimize what we do online the same way we tend to think about optimizing our activities offline? 

slide11

The answer is to

slide12

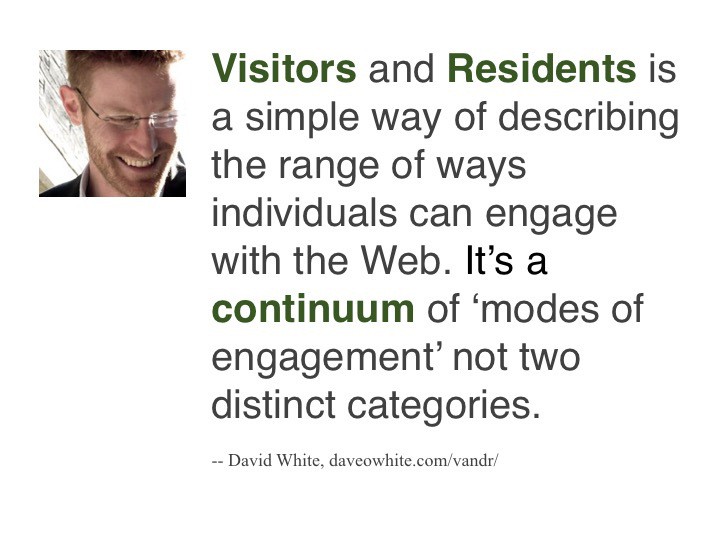
In terms of digital engagement, the V&R scholars developed a mapping exercise that aims to help people talk about their online activity in terms of being digital visitors and residents.  In David White’s words,

slide13So they describe a spectrum of engagement anchored on both ends by visitor activity, which tends to perceive digital platforms as tools.  When we act as visitors, we tend to be goal oriented – we get in and get out without leaving too much of a digital footprint.
On the other side of the spectrum, when we acts as digital residents, we tend to think of the digital in terms of a space that we inhabit along with other people.  Activity tends to be more extended and less goal driven.  When we act as residents, we are there to build a presence or an identity.

slide15

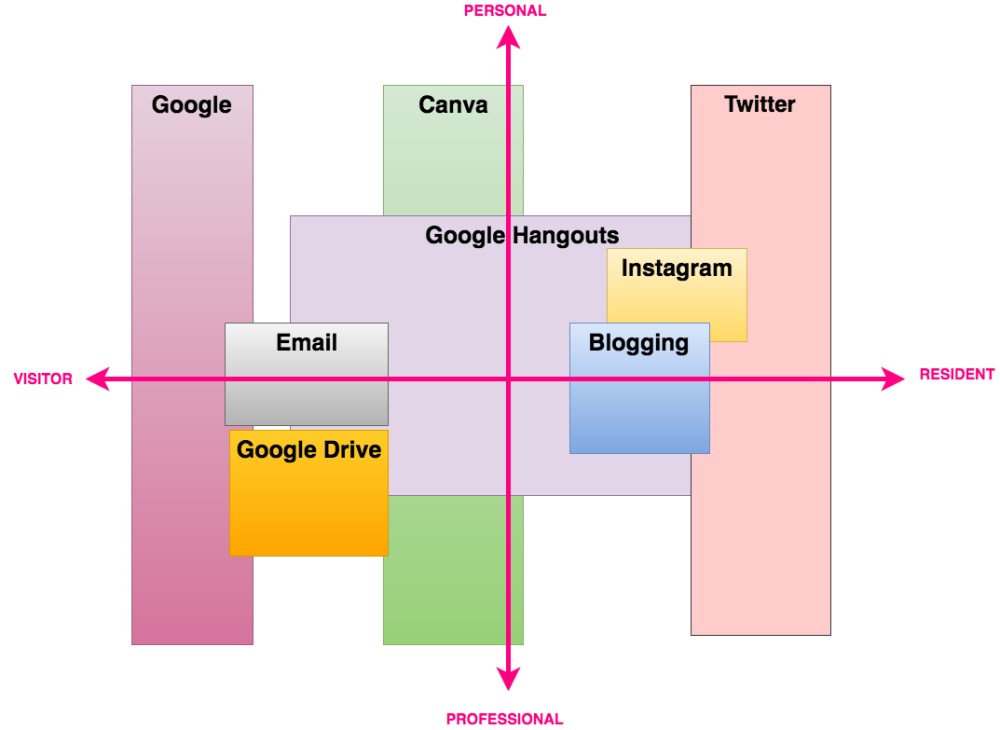
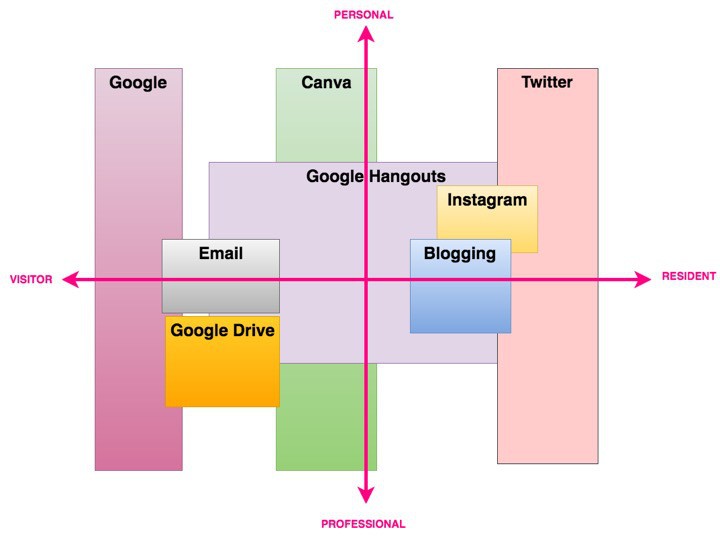
This is a simplified version of my V&R map. I’ve identified my primary digital platforms.  There are two axes – the first is the Visitor and Resident axes, which we’ve discussed.  In my case I tend to use things like Google search engines in very goal-oriented sorts of ways and I tend to hang out on Twitter – that’s where my community is.

The other axis is personal and professional use – sometimes you’ll see this listed as “institutional.”  It’s useful because many people tend to have dual lives in the digital world – in fact you might have one email account up here and a different one down here. But you’ll see that I am not particularly dualistic. I have a lot of overlap – and that’s actually the sort of observation that could lead to discussion on strategy and intentionality, right?

6.  Take a moment to draw your own map.  It doesn’t have to be comprehensive. You already have a list of platforms to work with.

7.  Talk it over with a partner. Consider these things as places to start:

slide17slide18slide19And when we finish, let’s think about exactly what we did.
  • We made a concept map – a form of data visualization – that anyone could have made regardless of discipline, professional context, technology, or other resources.
  • We reflected on behaviors and potentially attitudes and belief systems and shared those – in a concrete way with another person.  In this case, we talked about digital activity, but it could have been on anything.  If we  were in a professional development setting, we could have established some goals around that as well as set some plans.
  • We used active/experiential learning in order to do all of it – an approach consistent with best practices of adult learning.

slide20


Granularities of the Open Dissertation

Next week, the 13th annual Open Education Conference will be hosted in my hometown. This is an exciting time for me; in academic circles we talk about how certain conferences bring out all of “our people.”  For me, #opened16 is that conference. You are my people and I hope you consider me one of your’s.

Although the conference is firmly within my geographic community (and as such I have already been made responsible for bringing “my people” to the community’s beer and tacos), I am participating in this conference from a distinct position of in-betweeness.  My presentations make my point for me.

On Thursday I will be joining the inestimable Kate Bowles, Kristen Eshleman, Bonnie Stewart, Dave Cormier, and Amy Collier and potentially others for a panel discussion on the place of narrative inquiry in the context of open education.  This is a story of my now and future: I am working with Kristen on a project that combines data visualization and narrative inquiry to capture the complexity of experience and drive systems-level change. More and more my work involves data visualization in some way…not always in the sense of business intelligence or institutional reporting, but always in the sense of capturing a story and displaying it in a way that is intentional, interpretable, and useful towards a greater purpose.

On Friday, I will be joining the equally inestimable Jon Becker, Bonnie Stewart (again!), Alec Couros, and potentially others for a panel – workshop on the open dissertation.  This presentation represents my past: I completed a version of the open dissertation in February, 2016 with the support of Jon (my chair) and Alec (a committee member) and the entire open education community.

I want to take a minute to discuss the open dissertation and the origins of this panel discussion.  In reality, it is all Bonnie Stewart’s fault.

The discussion started in February or March of this year.  I had just successfully defended my dissertation – the research for which was situated in data visualization and open pedagogy – but when people call my dissertation “open,” they are really talking about how I executed the process and published the product.

Over the year of active reading, writing, and researching, I lived online. I blogged and tweeted openly throughout my dissertation process – a simple search will provide you with iterations of proposals, theories, models, and slides. There was the horrible writers block – After months, I cleared it in one day of pounding out four or five blog posts – one point after another in the most epic display of literature synthesis I think I will ever be capable of achieving.  Jon live tweeted his readings of my drafts. I invited Lee Skallerup and Valerie Holton into my defense hearing specifically to live tweet.  Between them, Alec, Jon, and the entire opened community, my defense turned out to be an international goodwill party I will remember for the rest of my life. Then I published my dissertation under a CC license and created a website for it, complete with open educational resources for teachers and students.

Mine was an open dissertation.

A week after my defense, Maha Bali wrote a ProfHacker post about the open dissertation, arguing that it represented a spectrum of activity – not a specific thing. She began to explicate the spectrum, offering Bonnie (Stewart)’s livestreamed dissertation and my live tweeted defense as examples.  Bonnie and I both commented on the post, pointing out some of the granularities of the process that lends it to personalization…open can be open in about a million different ways. Bonnie suggested the panel.

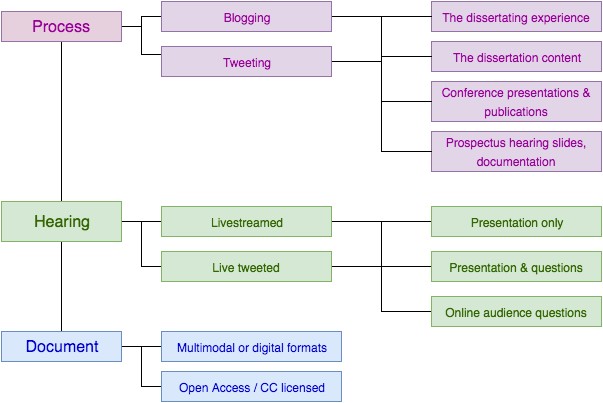
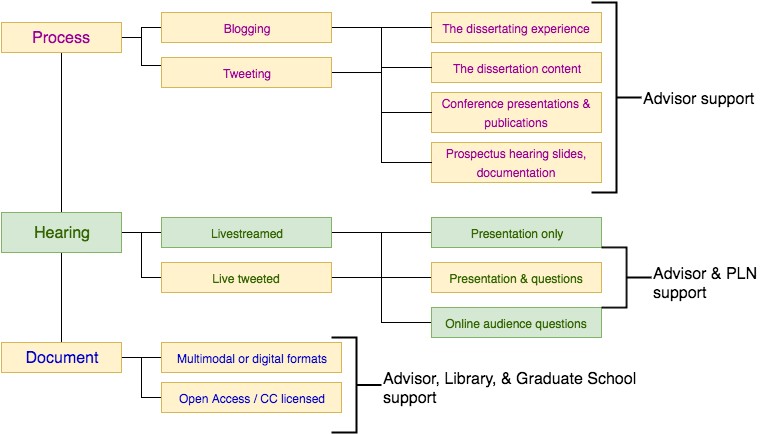
The panel discussion at #opened16 is meant to discuss some of those granularities and to examine some of the benefits, pitfalls, and institutional barriers that exist in exercising your right (and I do believe it’s a right) to an open dissertation. I was trying to map out the “spectrum” – after all, that’s my part in the panel presentation – but I’m not sure it’s a spectrum at all.  In reality, it’s more like a flowchart with decisions to be made all along the way.

Here’s a first pass* at understanding the granularities of the open dissertation.

granularities-of-open


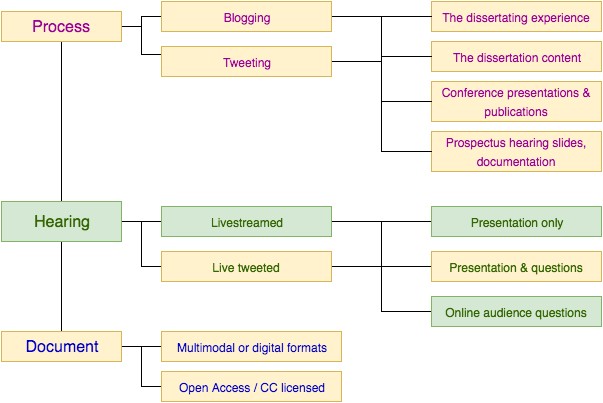
Now here are the “open” choices I made – in yellow.

lauras-open


See how that works? I have a lot of yellow boxes on my organizational chart – but how would that translate to a spectrum in comparison to someone else’s yellow boxes?  Are all yellow boxes considered “equal”?  What’s open and more open?  Quite frankly, I don’t care. People should do what’s right for them.  However, I do like the idea of a chart.  I am, after all, the data visualization person.  I want to be able to pick my boxes and talk to you about your’s.

However, this next part is important, too. If I go back into my diagram and identify the institutional structures that needed to be in place for me to do what I did…

lauras-open-with-institutional-supports

Then you’ll see how much of this depended on Jon’s support. Consider that.

And come to the session – help add to the org chart.*  Even as I get ready to publish this post, I see some glaring absences. So come, help fill it out because that’s a very open education type thing to do🙂.  It should be fun.


My Digital Resident & Visitor Map

I’m putting together a session for college and community leaders on digital platforms and professional development. It’s a short session – I only have 30 minutes.   Additionally, there are pre-set criteria for the session that essentially boil down to requiring an experiential adult learning experience. In short, I need to offer a taste of something larger and compelling, but that is also discreet, active, and meaningful on its own.

I’m struggling.  Thirty minutes is not a long time.

However, I often find that all goodness starts with completing a Visitors and Residents Mapping Exercise.  The digital visitor/resident model was introduced by David White, Donna Lanclos, and colleagues in 2011.  The model represents a spectrum of behaviors (visitors to residents) as compared to the older and now debunked digital natives narrative, which focuses on discrete groups of people.

When acting as digital visitors, people consider digital platforms as tools. Their behavior tends to be goal oriented.  They limit their time online to what is required to achieve their goals and tend to get offline without leaving much of a digital trace or identity. In contrast, digital residents perceive digital platforms as spaces more than tools: spaces that can be linked together and inhabited along with other people.  They tend to spend more time on the platform, leaving artifacts and developing identities within those spaces.

resident_visitor
A simplified version of my digital map, as of October 2016

This is my digital map. It shows how someone can be a digital resident and visitor at the same time both within and across platforms.  It shows that I tend to mix my personal and professional use of digital platforms.  It shows Google Hangouts as a significant area of context collapse; I use it as a tool to be sure, but it is also a space where I talk to my friends about their families, conduct research meetings, and give guest lectures…sometimes back-to-back, sometimes in the same hangout.  I have literally had girlfriend chats that shifted into business meetings that shifted back into girlfriend chats – changes signified through the on air button. Another interesting overlap occurs at blogging, instagram, and twitter.  I use these platforms differently, but my followers significantly overlap.  Instagram is kind of like my B side.

I like my map.  Now I just need to jump from this to a micro-presentation.

A Post-IT Post

A post-IT post before I leave Newark.

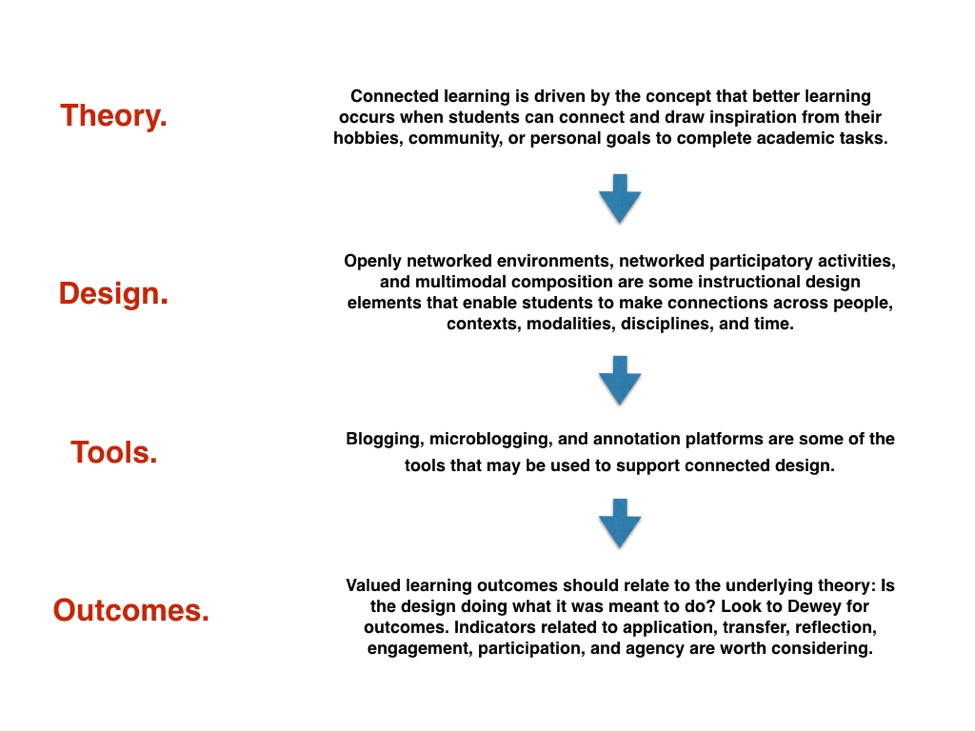
During my  panel presentation at #WCET16 this AM, I heard some colleagues slip into tech-first talk, despite the fact I had been espousing a pedagogy-first perspective (and they had been nodding vigorously) for almost an hour. To make matters worse, some of them would start sentences with pedagogy and end with tech; the tools-first paradigm is THAT ingrained in these people.  So, in my final moments, I pulled out my VCU example:

Desire to facilitate Connected Learning –> let’s try blogging and tweeting to promote connected learning –> let’s assess for connected learning.  EVERYTHING, is done and considered in the context of the pedagogy, connected learning.  I defined the terms, of course. I offered an example of a specific course (Collaborative Curiosity – you know it :)). Administrators around the room were nodding and smiling…it really is a great course design. So intentional.  People were drawn in by the course but some of them actually got my point: Connected Learning first, blogging/tweeting second.

Then a vendor in the room stood up and asked me if we had ever considered using his product (some sort of gated discussion forum…whatever) to promote student safety, security, and FERPA in Collaborative Curiosity.

giphy-3

I just kinda looked at him for a second and said “No.  I explained our pedagogical approach.  We needed a public forum to promote dialogue beyond the classroom. The walled garden might be fine for some pedagogical goals, but it was not consistent with our agenda, and it would have been a horrible pedagogical choice.”

Then I firmly shut down his FERPA talk and my friend the moderator shut me down before I really got going on the vendor.  It was probably for the best.

There were some smart people in that room. I’m really hoping that exchange drove home my point. Pedagogy first.  Tools second. Otherwise you do stupid shit like letting tech get in the way of your pedagogy because a vendor told you to.


The Problem with the EduSocMedia Lit: A presentation for WCET 2016

Tomorrow, Laura Pasquini, Ron Hannaford, and I will be presenting at the WCET Annual Meeting on methods, practices, and implications of Social Media Research. This came about because Ron, Director of Distance Learning at Biola University, was inspired to coordinate a panel to address the fact that higher education institutions need empirical data to direct and support faculty use of social media in classrooms.  He and Laura Pasquini had already worked together in the context of educational technology; Ron and I shared several heated discussions on the principles and practice of digital pedagogy at Online Learning Consortium’s Innovate Conference in April.

Although Laura, Ron, and I champion online learning, we bring very different perspectives to the table – perspectives that are fueled by our respective professional positions, educational backgrounds, and philosophical approaches. I can’t speak for them here, but I can provide you with some of my own ideas on the subject.

In titling our presentation “Social Media Research: Methods, Practices, & Implications,” I think we are dangerously close to missing the entire point.  We need to step back from a conversation of tools and technology to consider the big picture of the pedagogies we aim to develop and the nature of story we hope to describe. 

Let me back up. Over the summer, I worked with Laura Pasquini and Jessica Knott on a systematic literature review on the educational use of social media in higher education.  Laura P. and Jessica have been working on this for a little over a year, collecting and examining different aspects of the literature; I was brought in this summer specifically to help examine the research methods and study designs found within. It was a massive project, and as I’ve written previously I read over 500 articles, many of them twice.

Based on a preliminary analysis, two types of study dominate the edusocmedia research landscape: the quantitative survey and the action research/single site case study (represented here as a single entity because they almost always consisted of the same thing: descriptive pieces written by a practitioner who had developed and implemented something in their own classroom). Regardless of the study design, a large number of studies focus on either use or perceptions of social media (in general or for learning) by students, faculty, and/or administration.

I find this unfortunate, or, at the very least, unfinished.

In reviewing the edusocmedia at the depth that I did, I found a striking absence of experimental designs. I believe this is the point some of my colleagues would like to drive home and then change. In the U.S., we tend to privilege the wisdom of experiments, or at least well designed quasi-experimental designs, over other forms of research.  Many of my colleagues are looking for more (quasi)experiments involving structured cohorts and systematic approaches to interventions – at the tool level.  What impact does classroom Twitter have on the test score of group A versus group B? How does use of Facebook in that class increase student engagement (via validated instrument) in this group versus that? Does Twitter impact critical thinking more than the Facebook when implemented sequentially or simultaneously?

Or similar.

This is where I tend to veer away from some of my colleagues.  I like (quasi)experimental designs – I really do – and I find the lack of (quasi)experimental designs in the literature problematic.  However, I do not consider them the gold standard, because I believe in a balanced relationship between (quality) experimental and (quality) nonexperimental, (quality) qualitative and (quality) quantitative work.

I believe in a richly woven (and quality) story.  I believe it is a mistake to hold a discussion about the need for more (quasi) experimental designs in edusocmedia literature without situating it in a larger critique of the literature, including the questions we ask, the outcomes we seek, and the quality of the work we produce.

This is why I’m on the panel.

Let’s talk about quality of the literature for a moment. Systematically speaking, the edusocmedia research has a quality problem. To be clear, I don’t think it’s isolated to edusocmedia or even educational technology.  Furthermore, there are some beautiful articles out there. I am speaking at a general level.

Sampling. Surveys are frequently given to convenience sample populations. Qualitative work often involves extremely small sample sizes.  I am trained in qualitative research; I understand and live by terms such as snowballing, saturation, in-depth case studies and similar.  However, a one-time “focus group” of less than five students (without additional data) does not seem like the basis for a publication.

Research questions.  As previously mentioned, we tend to focus on perceptions and current use of social media among students, faculty, and administrators.  These are important questions; their answers lay a foundation for work on access, systems level change, and considerations for pedagogical scaffolding. However, I believe the literature is saturated in these areas and offer a relatively solid picture over the last decade on a fairly international scale (one exception is South America, but I’m unsure whether this is related to a lack of published research or a lack of research published in English). I am not suggesting you should not do your own needs analysis when necessary; I’m suggesting that you do not publish it unless it is remarkably different than what has already been published.

Unfortunately, given the consistently low number of article citations noted via Google Scholar, I wonder if we are reading the literature at any depth prior to publishing our work.  #Edusocmedia literature seems to be the thing that everyone writes but nobody reads…or cites.

Study designs and collection. We tend to fall back on a nonexperimental descriptive design by default. How many designs could be strengthened by the use of a pre-/post intervention survey rather than the use of an end-of-course evaluation? In terms of qualitative research – this is where my heart just plain hurts. Qualitative research requires knowledge and skills, just as quantitative work does.  There are definitions and standards to uphold.  There are indicators of rigor to follow. As a group of scholars, we need to raise our understanding and skill level in qualitative research.

Analysis and Reporting.  Transparency and replicability. Reported research is not actually research unless enough information is provided so that a reader to repeat the process. Methods sections.  Explanations of how data were analyzed – qualitative and quantitative.  This is essential.  As a group of scholars, we need to take our own research seriously. We need to identify our study designs correctly and report our data analysis methods (not just our course designs) with enough detail that others can replicate our work.

The Big Picture

I am concerned about improving the quality of what we do.  However, I am also concerned about building a compelling, cohesive body of literature that is as comprehensive as possible. In other words, we – as a body of scholars –  not only need to have a talk about how we do research, but why we do research.

We need to rethink our research questions, moving beyond use and perception of social media; however, we also need to move beyond social media. 

Social media is a collection of tools.  It is not a pedagogy. To show you what I mean, I’ve pulled a graphic from one of my other posts to serve as an illustration. Worldview. Pedagogy. Practice. Tool. Assessments.  Worldview and pedagogical assumptions drive the use of tools, such as social media.  To research and discuss social media without the broader context of philosophy and pedagogy is – at best – a waste of time and – at worst – harmful to collective knowledge. If we limit our research to the level of the tool (e.g. do students perceive a specific social media tool to be an effective learning tool?), we risk turning that tool into a pedagogical “black box:” We will have failed to analyze what makes that particular tool effective…and why.

picture1

When we situate ourselves entirely in specific forms of social media, we risk irrelevance, particularly if we are publishing in traditional journals that might take a year or more to see the light of publication. 

Tools change quickly – when faculty choose them, they are often doing so at the whim of administration (I’m thinking about learning management systems or clickers in particular) or the social media industry (Twitter, Facebook. They have a history of making significant changes and not once did they consult me about how it might impact my students or classroom).

I applaud the #edusocmedia field for exploring how students perceive the use of Pinterest (for example) in different disciplines and contexts.  However, it is just as important to ask what pedagogical actions Pinterest facilitates (collaborative resource curation…maybe?) and how those actions impact student learning (enhancing students’ ability to critique information sources…maybe?).  If we can elevate the discussion of tools to how they function (e.g. curation, collaboration, hyperlinks, multimodal creativity) rather than what they are, then our work will likely stay more relevant for longer periods of time.