I posted semi-recently about the convergence of my nerdery and work interests with the Urban Design Alignment Chart. That was a fun little project, but last fall I joined those two interests more seamlessly. So seamlessly, in fact, that I didn’t even think twice about it until just now. Last semester, I taught HISP471VV: Urban […]
Tag Archives: Design
Visual Arguments and Explanations
Today I had the pleasure of presenting on visual arguments and explanations for Jon Becker‘s class, EDLP 717: Communicating Research Findings (aka Telling Stories with Data). For their final project, Jon has tasked his students with producing a “high-quality modern report” from real data on employee followership for a hypothetical client. While Jon has spent the last weeks walking them through data analysis and statistics, he thought I might have something to say about information design and reporting.
I have a lot to say about information design, mostly driven from attending Edward Tufte’s day-long lecture on presenting data. To prepare for this presentation, I reread Tufte’s books and included a lot of images directly from his books (or, more frequently, from his blog in which he uses his own book images to expand the conversation). However, I also introduced the versatility and ubiquitousness of visual explanation through Berinato’s matrix of “data visualizations that really work” and incorporated other online resources such as the Data Visualisation Catalogue and Ann K Emery, so it wasn’t all Tufte, all the time.
This presentation came at the right time for me, personally. The work that I do involves a lot of information design, although I did not recognize it as such until my recent deep dive into Tufte’s work. I rely on his principles (forced visual comparisons, focus on causation, annotations, direct labeling, smallest effective difference, etc.) every day in how I communicate with the rest of my design team. Since I’ve completed my deep-dive, I find that I am using these principles more strategically and consistently and sharing that intentionality with my teammates…which in turn has improved their information design and communication.
So thank you, Jon and EDLP 717, for giving me several hours of your time. Once again, I learned as much as I taught.
Here are some slides.
Featured image by Carlos Muza on Unsplash
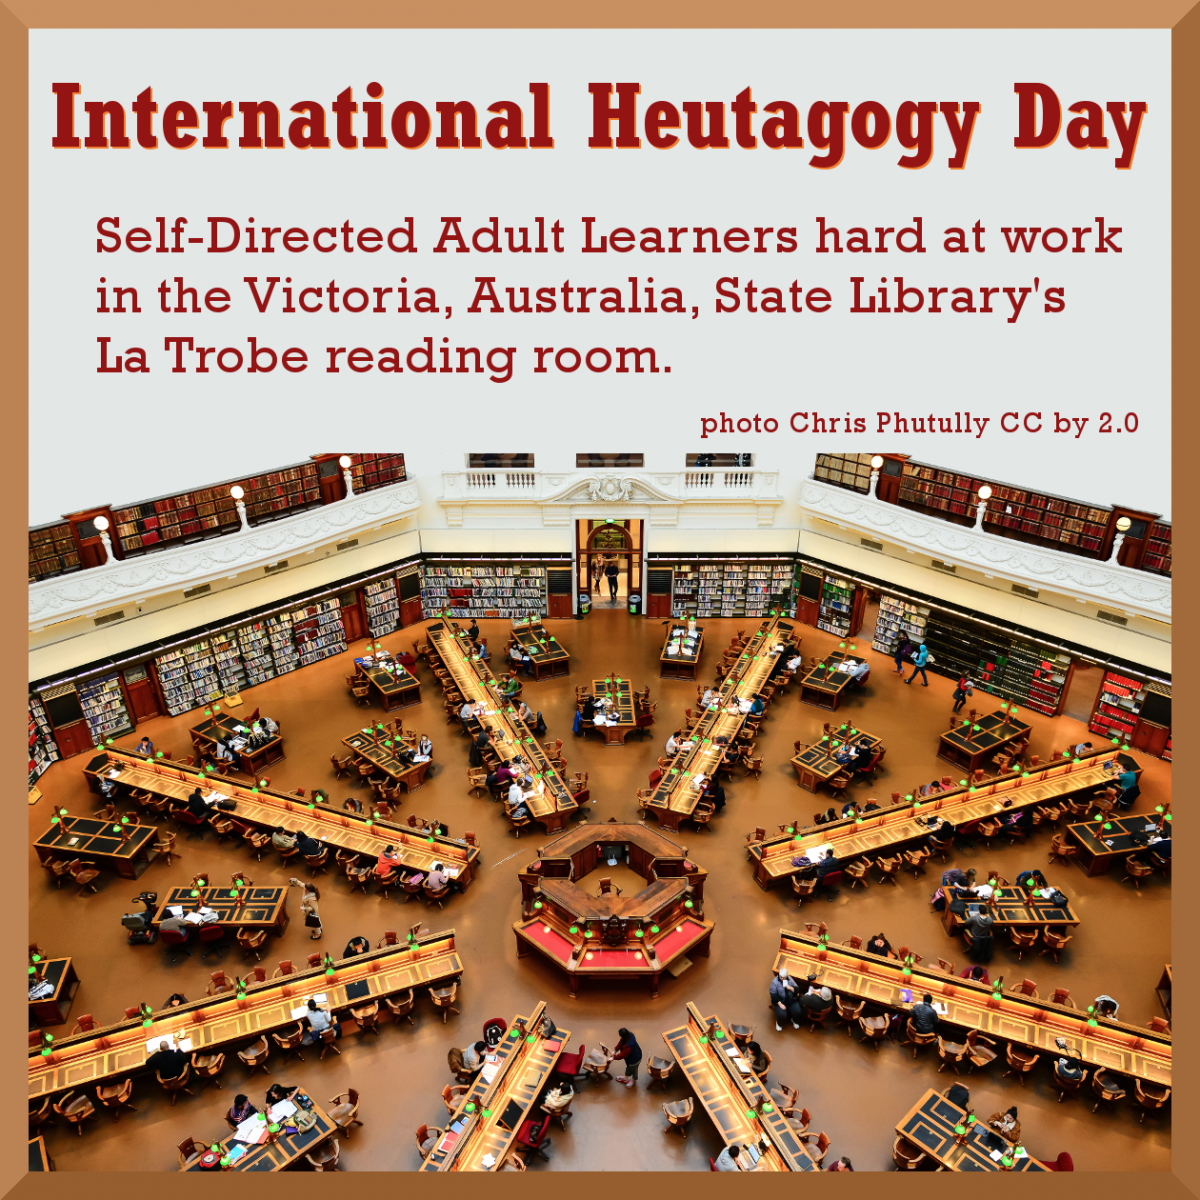
Happy International Heutagogy Day!

I declare February 18th as International Heutagogy Day! Heutagogy (based on the Greek for “self”) was defined by Hase and Kenyon in 2000 as the study of self-determined learning. I’ve amended their definition to include Self-Directed Theory, thus Self-Directed Adult Learners.
Learn to edit Wikipedia
Join me at the Western Institute for Social Research (WISR) in Berkeley, California, next Monday, January 15th at 6 pm
Learn to edit Wikipedia!
Bring your laptop and we will all sign into the online course and discuss the eventual creation of a WISR Wikipedia page.
Click on the flyer to enroll or download the flyer below.

Download pdf: Wikipedia_course_flyer pdf

My College Degree as a Digital Humanities Project

Digital Humanities by Craig Bellamy CC BY-NC-SA 2.0
I’m developing a new model for adult learners so they can avoid the experience I had while trying to improve my skills at a Community College. Combining Self-Directed Learning, Computational Thinking, Digital Pedagogy, Open Education and Open Social Scholarship theories with Open Education Resources (OER), Free and Open Source Software (FOSS) and ePortfolios, I intend to create a free platform for any adult learner to document and reflect on their diverse learning experiences. I think simplifying all these dense and often conflicting learning theories into an approach (Praxis) any adult student can use to design their own self-directed education pathway will be useful. (Heutagogy)
I’ve been working on these ideas for three years, starting with attending a presentation by faculty from Evergreen College in Washington on integrating individual courses’ homework assignments across institutional silos. That led me to eportfolios as a way to collect all types of evidence (digital objects) of learning. Learning about tagging and metadata for discoverability on the internets, I observed the need for a controlled metadata vocabulary to allow searches for emerging patterns. These new ways of looking at one’s learning has the potential to suggest new constructions of learning experiences and new areas of research.
I belong to the Association for Authentic, Experiential and Evidence-Based Learning (AAEEBL) and have attended their conferences, including a session at this year’s 8th Annual Forum on Digital Learning and ePortfolios at the 2017 AAC&U conference in San Francisco. The ePortfolio Forum is jointly sponsored by AAC&U’s project, VALUE: Valid Assessment of Learning in Undergraduate Education; the Association for Authentic, Experiential and Evidence-Based Learning (AAEEBL), the association of ePortfolio professionals; and the International Journal of ePortfolio (IjeP). At this year’s AAEEBL Conference I joined the Technology Special Interest Group and convinced them to take on my idea for an ePortfolio Ontology as their first project. I’ve also joined the Association for Learning Technology, the UK group to “advance education through increasing, exploring and disseminating knowledge in the field of Learning Technology for the benefit of the general public.”

The Hurley Information and Technology Convergence Center at the University of Mary Washington in Fredericksburg, Virginia. Photo by MCW
I recently realized that my idea of ‘finishing a Bachelor’s degree while using Free and Open Source Software to create a learning eportfolio on my own domain and blogging about it in public’ is a Digital Humanities project. In 2016 I attended the Digital Pedagogy Lab Institute at the University of Mary Washington, VA, home of ds106 and the Domian of One’s Own initiative. I learned about UMW while attending the Digital Humanities Summer Institute at the University of Victoria, BC, where I took Critical Pedagogy and Digital Praxis in the Humanities from Jesse Stommel and Chris Friend. This year I took two courses during DHSI to support my project; ‘Open Access and Open Social Scholarship’ and ‘TEI and Metadata.’ That led me to explore metadata ‘triples’ which led to the concepts of graph databases and ‘faceted’ searches.
Lincoln as a boy reading at night. Library of Congress CollectionNow I want to learn how to integrate a FOSS graph database (Neo4j?) with FOSS curation tools (WP, Omeka, GitHub?) to utilize the power of humanities computing and the semantic web to document and reflect on my learning experiences. And then document my reflections and be able to do faceted searches of everything I’ve created together with everything I’ve curated into my database. I need to learn to appropriately tag all these digital objects with metadata so that they integrate seamlessly with the semantic web. Hopefully this can be automated to a large degree.
My plan is to structure my Metro State University’s College of Individualized Studies Bachelor’s degree as a Digital Humanities project using an eportfolio to document, reflect on and publish my learning. Which tagline do you like: Learning in Public or Learning Out Loud? Or suggest another.
Learning Strategies and Goals
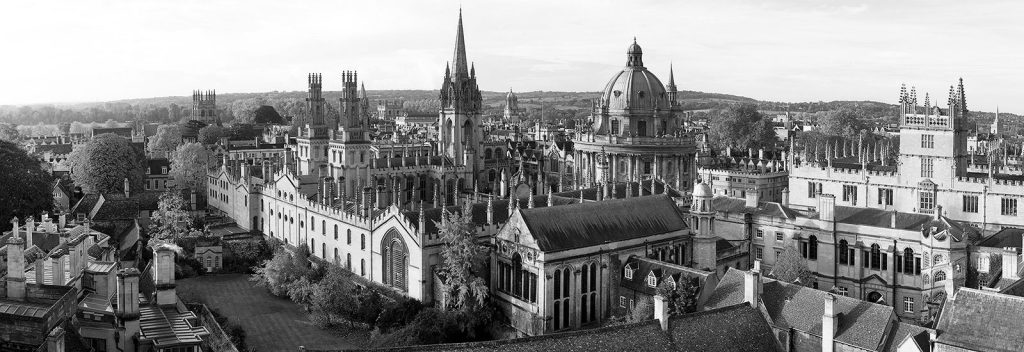
Oxford University
“A university training…aims at raising the intellectual tone of society, at cultivating the public mine, at purifying the national taste, at supplying true principles to popular enthusiasm and fixed aims to popular aspiration…at facilitating the exercise of political power, and refining the intercourse of private life.”
I don’t think this quote from Cardinal John Henry Newman’s 1852 book “The Idea of a University” aligns very well with our contemporary concept of a ‘Liberal Education.’ I’m not sure what a quote from a Catholic priest, from a time before Charles Darwin, Karl Marx or Albert Einstein influenced the academy, has to do with modern education at all. I think we are past the notion of “Universal” ideas and values.
In the mid-Victorian era, very few people were educated and many graduates never had to hold a job. The British Empire, like the American Empire, didn’t require educated men, just well trained, obedient men. With corporations controlling every aspect of our lives, American Universities are now turning out highly trained technocrats (of all gender identities) to run this Neoliberal Empire.
To me, a more appropriate quote would be from a 1959 graduation speech by Leo Strauss, the University of Chicago political philosopher and primary theorist of Neoliberalism;
“Education to perfect gentlemanship, to human excellence, liberal education consists in reminding oneself of human excellence, of human greatness. …we know that there cannot be the simply true substantive view but only a simply true formal view; that formal view consists in the insight that every comprehensive view is relative to a specific perspective, or that all comprehensive views are mutually exclusive and none can be simply true. The facile delusions which conceal from us our true situation all amount to this, that we are, or can be, wiser than the wisest men of the past. We are thus induced to play the part not of attentive and docile listeners but of impresarios or lion-tamers. Yet we must face our awesome situation, created by the necessity that we try to be more than attentive and docile listeners, namely, judges, and yet we are not competent to be judges. As it seems to me, the cause of this situation is that we have lost all simply authoritative traditions in which we could trust, the nomos which gave us authoritative guidance, because our immediate teachers and teachers’ teachers believed in the possibility of a simply rational society. Each of us here is compelled to find his bearings by his own powers however defective they may be.” http://www.ditext.com/strauss/liberal.html
Not to worry, Neoliberal Universities and corporate employers will surely supply you with any traditions they think you need.
I’m retired, don’t need job training and have been watching the creeping fascism of Neoliberalism since Reagan was elected President. I’m also working class and an American-Scot so I look to other educational traditions. After inventing compulsory education with “The Education Act 1496”, whereby the Parliament of Scotland required that landowners send their eldest sons to school, “[t]he Mechanics’ Institute movement began in 1800 when Dr George Birkbeck of the Andersonian Institute in Scotland gave a series of lectures to local mechanics. The nineteenth century term “mechanic” meant artisan or working man. The lectures were free and proved popular. They led to the formation of the Edinburgh School of Arts (1821) and the London Mechanics’ Institute (1823). The movement spread quickly throughout the British Empire.” http://mivic.org.au/history-of-mechanics-institutes.html
I belong to the San Francisco Mechanics Library, which was established in 1854, just four years after California became a state. I attend lectures, classes, book groups and writing groups, in addition to the library and computer lab. One of the reasons I chose Metro State is that I’m not interested in a traditional (or Neoliberal) education. In addition to getting credit for prior learning, my learning strategy is to use an eportfolio, as a Digital Humanities and Open Education project on the internets, to document my lifetime of learning together with all my coursework. This will allow me to reflect on how these learning experiences are connected to the wider world of ideas and for other learners to participate and comment. This is a radical idea for most Universities.
Here’s an example of one workers’ plan, learned at a Mechanic’s Institute, for documenting his learning (while Cardinal Newman was busy setting up a Catholic University in Dublin for the Pope):
“In an essay, remarkable at once for the originality of its views and the practical good sense it contains, John Foster recommends the propriety of every man writing memoirs of himself, not as an exercise of ingenuity — not as a means of drawing the world’s regard — but to fix in a man’s own mind, a sense of the progress he has made in moral and intellectual ideas to mark the change in his sensations which a prolonged experience of life produces and to excite a feeling of gratitude for those many providential interpositions which the most careful observer can scarcely fail to recognize as exercised in his behalf.” Diary for 1858 by Andrew Mcllwraith (Craftsman and former Mechanic’s Institute student) from More of a Man: Diaries of a Scottish Craftsman in Mid-Nineteenth-Century.
In order to get “a sense of progress” I’ll document the educational conferences, online courses and webinars I’ve attended, as well as the research I’ve been doing on Open Education, Networked Knowledge Organization Systems, graph databases, semantic metadata and the philosophy of semiotics.
I also intend to take more writing courses like “Memoirs and Creative Nonfiction” and communication and social research courses to deepen my work with community groups in social justice and the educators I’m working with to develop my local community colleges’ student leadership. I don’t see any Metro courses that teach one how to build a personal information technology infrastructure but perhaps I’ll find some.
I highly recommend the media, computing and learning textbook The Future of Thinking, Learning Institutions in a Digital Age written by students, educators and others interested in Higher Education in collaboration with the Humanities, Arts, Science, and Technology Advanced Collaboratory (HASTC). http://futureofthebook.org/HASTAC/learningreport/about/ or get a polished version for free on Google Play https://play.google.com/store/books/details/Cathy_N_Davidson_The_Future_of_Thinking?id=7B5znR_ki4MC
They (collectively) wrote;
“Over the past two decades, the way we learn has changed dramatically. We have new sources of information and new ways to exchange and to interact with information. But our schools and the way we teach have remained largely the same for years, even centuries. What happens to traditional educational institutions when learning also takes place on a vast range of Internet sites, from Pokemon Web pages to Wikipedia? This report investigates how traditional learning institutions can become as innovative, flexible, robust, and collaborative as the best social networking sites. The authors propose an alternative definition of “institution” as a “mobilizing network”–emphasizing its flexibility, the permeability of its boundaries, its interactive productivity, and its potential as a catalyst for change–and explore the implications for higher education. …In order to create a new field of digital learning, we must bring together research, knowledge, methodologies, and expertise from radically distributed existing fields— from the media and design arts to history, sociology, communications, psychology, philosophy, education, policy studies, political science, the computational sciences, engineering, and all points in between. A field cannot exist without institutional grounding.”
As far as inspiration for my learning, I look to a more contemporary, and pertinent source. Though an academic, twenty years ago Richard Rorty predicted:
“At [some] point, something will crack. The nonsuburban electorate will decide that the system has failed and start looking around for a strongman to vote for — someone willing to assure them that, once he is elected, the smug bureaucrats, tricky lawyers, overpaid bond salesmen, and postmodernist professors will no longer be calling the shots.
And this:
One thing that is very likely to happen is that the gains made in the past forty years by black and brown Americans, and by homosexuals, will be wiped out. Jocular contempt for women will come back into fashion. The words “ni**er” and “ki*e” will once again be heard in the workplace. All the sadism which the academic Left has tried to make unacceptable to its students will come flooding back. All the resentment which badly educated Americans feel about having their manners dictated to them by college graduates will find an outlet.
And, finally, this, the eerie anticipation of our current presidential predicament:
He will be a disaster for the country and the world. People will wonder why there was so little resistance to his inevitable rise. Where, they will ask, was the American Left? Why was it only rightists like Buchanan who spoke to the workers about the consequences of globalization? Why could not the Left channel the mounting rage of the newly dispossessed?” (from Achieving Our Country: Leftist Thought in Twentieth-Century America by Richard Rorty)
In “Philosophy as Poetry, a slim volume that contains the 2004 Page-Barbour Lectures, …he suggests that “the imagination is the principle vehicle of human progress.” It makes for a memorable slogan, especially for those of us who would like to see federal support of the arts and the humanities — along with such basic goods as health care and environmental protection — continue. But I think a sound pedagogy can be made out of it as well, one that highlights the importance of, among other things, social hope. After all, it is up to us to imagine a different future for our democracy.” from Rorty and Social Hope – Los Angeles Review of Books https://lareviewofbooks.org/article/rorty-social-hope/
Richard Rorty had a pragmatic approach to education as well. He recognized the conservative values of tradition and ‘truth’ and suggested these would be best leaned in primary education; what he termed education as socialization. He suggested that higher education was the appropriate place to learn the liberal values of freedom and progress through rational criticism, or education as individualization. Unfortunately, Rorty had no sympathy for radical ideas like Mechanic’s Institutes or Universities Without Walls, so we don’t know what he would think about Metro State.
I hope to learn more about alternative educational models and research their efficacy. As Rick Hendra and Ed Harris note in their paper The University Without Walls Experiment;
“The only UWW unit actively engaged over the years in research and publication efforts appears to be the UWW at the University of Minnesota, (now called First College). [Metro State]…may have developed instruments worthy of examination or replication by other researchers so that good comparative data might be made available.
…We don’t know how the educational outcomes of the UWW approach, centered on mentoring relationships, compare either to traditional undergraduate education or to adult-oriented continuing education programs. We don’t know — and must find out — the principles of good practice established by these programs. What we do know is that the existence of fifty roughly equivalent programs, operating in a wide variety of academic institutions, provides opportunities for comparative studies that are exceedingly rich.
It is an historic irony that such an ambitious experiment was able to generate so little published research. It would be regrettable were that irony allowed to persist: the founding generation of educators may not be available much longer and they are likely the best references we have as to how all these experiments, separate and together, played out. As much as we need to document their individual recollections, we need even more urgently to recapture their vision and their wisdom as higher education enters a new period of turbulence fed by technology and competitive pressures.” http://people.umass.edu/~hendra/Unpublished%20Results.html
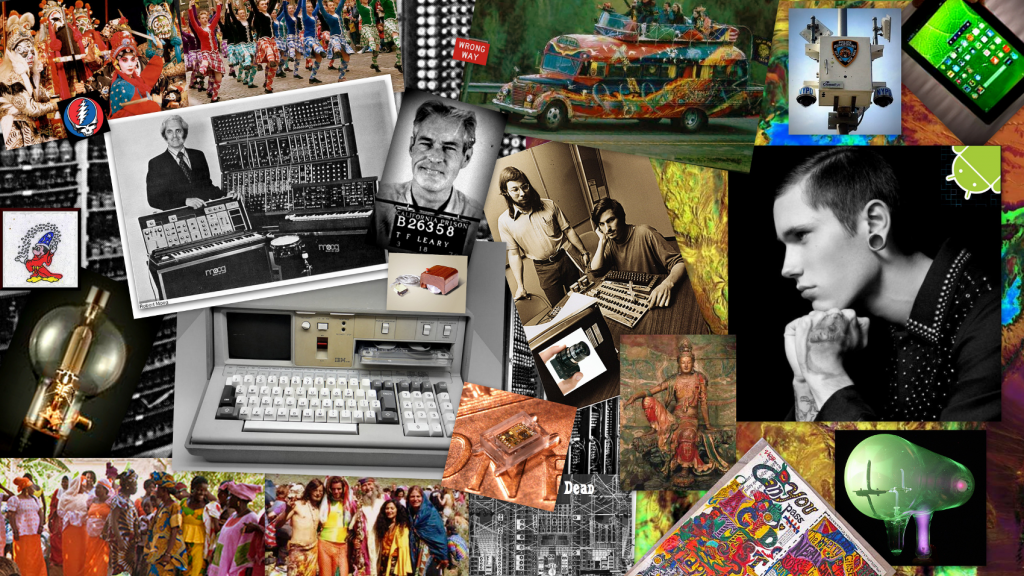
My first digital media project 2013
My goal is to develop a (free and open source) digital approach to a liberal arts education, both heutagogy (theory of self-directed learning) and praxis, that will support anyone with access to a computer as they learn how to learn. From savants in the global south to illiterate inmates of America’s prisons, having a way to document, reflect on and share one’s learning should help people collaborate to improve their lives.
As for ‘social hope’, I prefer Antonio Gramsci’s famous quote from his Prison Notebooks, written while a prisoner of Benito Mussolini’s Fascist regime; “I’m a pessimist because of intelligence, but an optimist because of will.”
Connection & Digital Architecture
Yesterday I had the great honor of dropping by the Digital Pedagogy Lab Institute (#digped) to spend the day with Kate Bowles and Maha Bali and participants of the networks track. Informally, I was there to be with my friends who challenge, inspire, and remind me of who and how I want to be in the world. They did not disappoint. Formally, I was there to give a 15 minute talk on practical ways to start conversations with students around the ideas of networking and connectivity.
The talk really never happened, as we opted instead to wind in and out of some of my slides, leading to a 90 minute conversation on voice, audience, and performativity. It was a deep talk. Clearly, the people in the room were hungry to hear and express meaty thoughts. We only crossed into the ‘doing’ realm once, a rabbit hole conversation on care bots, their implications and potential impact. I failed at keeping our attention in the translational space altogether. No one wanted to stay there with me.
Thinking is unfulfilling without the doing, and vice versa. Freire and Dewey taught us that. DaVinci taught us that. In Time and Free Will, Henri Bergson, wrote:
Let us consider…the feeling of grace. At first it is only the perception of a certain ease, a certain facility in the outward movements. And as those movements are easy which prepare the way for others, we are led to find a superior ease in the movements which can be foreseen, in the present attitudes in which future attitudes are pointed out and, as it were, prefigured. If jerky movements are wanting in grace, the reason is that each of them is self-sufficient and does not announce those which are to follow. If curves are more graceful than broken lines, the reason is that, while a curved line changes its direction at every moment, every new direction is indicated in the preceding one. Thus the perception of ease in motion passes over into the pleasure of mastering the flow of time and of holding the future in the present.
In considering of the arc from thinking to doing, we must consider the in-between as well. The translation from thinking to action is an interpretive art, not a given. Thoreau on the difference between a genius, an artist, and an artisan speaks to this.
Translation is a form of connection and it deserves time and respect. Possibly it is elusive and therefore uncomfortable. I need to get better at inspiring people to stay in that space.
But anyhow, here is the talk.
John Dewey famously wrote that “education is a process of living and not a preparation for future living.” He demonstrated this in his laboratory school, where children worked together on everyday tasks, driving their own collaborative inquiry about the world around them. DaVinci, too, had great reverence for learning through living and tinkering in the world. He put it a bit more directly than Dewey: “Learn how to see. Realize that everything connects to everything else.”
How “everything connects” speaks to context. In a recent talk, Jon Udell said, “Context is a service we provide each other. It is a fluid thing, a negotiation across parties.” If this is true, if we accept that we drive each other’s learning through iterative, multi-faceted, and multi-sourced forms of feedback, what does ‘providing context’ it look like in teaching and learning environments, particularly digital ones?

What are some of the things students gain by learning on the open web? Why do we have them blog instead of turning in assignments on paper? Why do we have them annotate readings in Hypothes.is rather than reading photocopied packets? Why do we hold Twitter chats?
Beyond the superficial reasons (“it’s an online course”) and more basic than the values of accessibility and transparency (which only hold up in some contexts and for some people), digital spaces have a quality that paper-based spaces do not have.

Digital architecture facilitates intentional and serendipitous connection. Hyperlinks link documents across disciplinary silos, geography, and time. Hashtags cross communities and personal networks. The embedding of images, video, .gifs, and audio takes the phrase “here, let me show you” to an entirely different level. Tags enable the curation (collection, connection) of documents through more than one conceptual planes (I like to think of them like strings through a stack of swiss cheese slices). FSS feeds will juxtapose content in the most interesting patterns – this is the primordial stuff of discovery.
At a fundamental level, digital spaces function through acts of connecting. So how can we capitalize on digital architecture to help students grow their connective fluency, their capacity for thinking in, building, and seeing connections?
Harel and Papert (1991) wrote:
Students faced with performing or creating a product for an audience will learn more deeply because they must externalize their thoughts for the purpose of sharing them. Once thoughts are made explicit, they can be studied, refined, and made sharper through the process.
Students need concrete things to hold onto particularly at the beginning of their learning journey. They need to see a thing, fiddle with it, correct their own thinking, show it to other people for feedback. These concrete things, or “meeting posts” (I probably co opted meeting posts from Wenger’s communities of practice work) are extremely useful tools for instructors, as they provide a shared, concrete space for mentoring.
So what if we use aspects of digital architecture to talk with students about cultivating their understanding of connections and contexts?
The idea of starting with basic building blocks is so basic. Why do we not do it in digital composition or expression? Why do we force students to work at the transcendent level of the gestalt?
Recently I took a three night adult-only art workshop. It was an interesting experience for a number of reasons. I was surprised by the fear expressed by the women around me: fear of making mistakes, fear of painting something childlike, fear of using too much paint, the list went on and on. (I did not share their specific fears, much to their collective dismay. One literally sniffed at me: “You’re not afraid of anything, are you?”). The teacher guided them effectively through their fear by breaking things down into the basics.

Shapes. Positioning. Shadow. Color combinations. Balancing positive and negative space. These are basics – basics that she could remind us to see (“Remember to look at your negative space!”), basics that she could provide feedback about (“Your shadow should be darkest right under the subject!”). Her method worked.
I spent several years studying how students in higher education incorporated digital architecture into their compositions. The full dissertation is here, along with additional student-facing and faculty-facing information, assessment ideas, and so forth. Briefly, I discovered that students were instinctively using hyperlinks, images, and hashtags to make really interesting sorts of connections across concepts, disciplines, people, and their own learning across time. However, no one was helping them refine these ideas so that they could improve their connective expression. No one, at least in my environment, was helping to guide them to making it an intentional, artful practice.
What I found by working as a connected learning coach in these digital environments was that digital architecture was a wonderful place to start conversation around audience, voice, connectivity, and providing context. You can provide examples, social network visualizations, advice. These are concrete things that students can look at, play with, and discuss like shapes, positions, color, and shadow.


Talk with students about digital architecture. Talk to them about it to calm their fears about blogging. But also talk to them about it as a jumping off point for deeper, more abstract conversations about voice, audience, identity, performativity. Talk to them about it as a means to enrich their self-expression, build and leverage their social networks, enhance their capacity to provide context, create collective knowledge, privilege connection as an (the) act of learning.


Leading through Visualization
Two weeks ago, Bonnie Stewart invited me to speak to #Ed6170: a faculty summer course in educational leadership sponsored by the University of Prince Edward Island. Bonnie focused her curriculum around leading under complex and changing conditions, because (1) it’s relevant and 2) it’s challenging. In a move that I find particularly admirable, she created assignments that require her students engage with the content through multiple modalities. Among other tasks, they will be making concept maps and infographics.
Bonnie and I went back and forth for several weeks on how I might contribute to the curriculum, and we finally settled on the idea of leading through visualization because it hit on strategies for leading teams through complex problems and contexts while also providing her students with some concrete tips on how to complete their visual assignments.
Creating this presentation required me to connect pedagogy, leadership, and information visualization, so I drew a direct line through constructionism (Papert) to learning communities (Wenger) to reflective practice (Schon) to quantitative data visualization principles (Tufte). It was fun to build the scaffolding for what is intuitive for some people, but not for others. This presentation is about pointing out the obvious. I think simplicity is underestimated. Sometimes, you just have to say things.
The following is a summary. Email me at lauragogia@bandwidthstrategies.com if you’d like the entire slidedeck. I’m always happy to share.

Current trends in leadership
In the past, leadership development involved providing strategies for commanding, controlling, and wielding one’s authority. Power was housed in one’s position at the top. Information flowed in one direction. However, the world is more complex than it used to be. There is more information to know. Conditions change rapidly and therefore what needs to be known in a given situation also changes rapidly. Complex problems require highly creative approaches to problem solving.
The constant influx of data from every direction and the dynamic conditions surrounding us has led to significant changes in the workplace. The focus is no longer on the single person or product; rather it is on relationships: relationships between pieces of information, between people in terms of organizational teams and collaborative partnerships, and between workflows across those partnerships. The emphasis on relationships in the workplace and the world alters how leaders must behave. Influence replaces Authority. Collaboration replaces command and control. Google “modern leaders” and you will not find descriptions of how to be authoritative or “top-down” officials; what you will find are a number of frameworks for transformative, collaborative, creative, inclusive, and design leadership.

The approaches to effective leadership require similar skillsets: transparency and accountability, reflective practice, pattern-identification and connection-building, and flexibility in the face of change. The purpose of this presentation is to introduce information visualization as a strategy for practicing these skills. I will present you with three arguments on why the ability to present data visually is key to modern leadership. I’ll provide examples specific to higher ed teaching and administration and provide design tips so that you can integrate this into your current practice or if you are already doing some of these things, perhaps approach them with a little more intentionality.
Keep the following connection to pedagogical theory in mind: A good visualization makes the abstract concrete. From a constructionist standpoint, making the abstract concrete facilitates deeper learning, because learners are externalizing their thoughts for the purpose of sharing them. Once the thoughts are made explicit, they can be studied, refined, and made sharper through the process.
Power of visualizations: Meeting posts, big pictures, and pathfinders
Meeting posts. Visualizations create a concrete meeting post for collaboration and sharing as well as opportunities for transparency and accountability. I was tasked with creating a comprehensive recruitment plan for my previous workplace, which supports four programs and an annual conference, each with overlapping but distinct audiences. Additionally, the audiences in question transcend organizational boundaries and professional sectors. I needed to develop an outreach plan that was efficient, sustainable, and offered obvious paths for expansion.
Furthermore, I needed to think about the structure and location of the data; what contact info would go in our listserves? Mailchimp? Were would content go so that it would be accessible? How would the data be structured so that we could access lists that lived in different locations without creating duplicate communications? Finally, I needed to find a way to effectively include the rest of the team in the planning, since they are actually more knowledgeable than I on the day-to-day operations and historical knowledge of the institute. I also needed to find some pathway for negotiated accountability for the student workers who would be doing much of the work.

The key to success was the whiteboard hanging behind my desk. This is a simplified version of the visualization I used to create our communication plan. On the left we have the communication platforms – social media, emails, mailings, & media postings by potentially interested parties. In the middle are the programs listed and then on the right side of the board are listed the physical location of the lists and the person responsible for the job.
Tables on whiteboards are so common that we take them for granted. However, they are an extremely powerful collaborative leadership tool. Here’s how a visual meeting post works to promote collaborative leadership.
- When speaking with my director, I focused us on the left side; She shared a significant amount of historical knowledge and cultural nuance as we moved through the concrete list.
- When speaking with my content developers – my social media coordinator and copywriter, we focused on the patterns made by the X’s under the programs. When was it possible to group messages about certain program for certain markets. In developing our social media plan, there needs to be a very different feel, a different photograph for a Facebook post that includes information about Program 2 and the Conference, as compared to a Facebook post that combines Program 3 and the conference. Same with email and mailing content. Having a concrete pattern of X’s helped us brainstorm about the possibilities.
- When speaking with my communications manager, we started with the data location and then moved left. Together, we needed to design the actual databases – how would we prevent duplicate communications when we had people who crossed lists and lists in different database systems? The whiteboard visualization gave us a concrete model to test; we walked through mailing scenarios until we understood what filters would have to exist, what rows would be needed in the excel spreadsheet, in order to prevent duplication.
- When speaking with my student workers, we focused on the last columns, their assignments; we set expectations and deadlines and we could take the opportunity to negotiate, since they know their summer schedules better than I do – I merely presented the work that needed to get done and the team really helped me distribute it in the way in which they were most likely to succeed.
Transferable concepts from this example:
- The whiteboard is too obvious to hide. This was hanging in a physical shared location that everyone accessed everyday. They couldn’t help but see it. You can have these in online spaces too, like a homepage that you have to click through to get to anything else. However, the point is that successful meeting points are never hard to find.
- The whiteboard is easy to erase and change. Our communication plan went through multiple iterations prior to its final iteration – imagine how tiresome and potentially confusing that would have been if we had been moving through multiple document versions and saves. If you have a version that you think you should save, take a picture.
- The whiteboard is accessible. Anyone can write on the whiteboard. There are no administrative privileges or tech skills necessary.
- Whiteboards support multivariate approaches. There are a variety of ways you can convey additional layers of information if necessary: hashed lines, sticky notes, color coding…In our case, each program has a “signature color” so it makes sense to color code anything and everything to the signature color to help people recognize it instantly.

Big Pictures. For the amount of work that gets done in my previous workplace, it is very efficiently staffed with a director, an associate director, two program coordinators, and six rotating student workers. There were a lot of moving parts involved. I noticed that a significant number of deadlines were being missed or forgotten because of miscommunication or a failure understand expectations.
I had experienced this phenomenon before, as a physician. When you work in environments where conditions change quickly, tasks are complex, and staff come and go, it is easy to lose track of the big picture. This is why the most dangerous time for a patient in the hospital is immediately after a shift change: because it is difficult to transfer information from one shift to the next. Obviously healthcare technologists are working on this problem, but one of the most basic and universal components to the solution is what’s typically called “the board.”

Anyone who has spent anytime in a hospital or watching medical dramas on television should be familiar with this sort of board. It’s a meeting post where all the rooms and patients are listed, along with their essential information and the people who are assigned to taking care of them. At every shift change – or anytime the team needs to get refocused – a staff member will ”run the board” to make sure everyone is on the same page about priorities and personal responsibility.
So, given that the team did not seem to be on the same page, I adapted the concept of the OR board for our office.

One Friday afternoon, I gathered the students and program coordinators. I asked each one to tell me the story of their program from the beginning to the end of the program cycle. I used sticky notes to mark all the deadlines and tape to mark the end of the fiscal year and winter break, as these are very real, hard deadlines for a lot of things. It took a couple of days to get everyone’s input and as we did, questions were raised and either tabled for our strategic planning retreat or answered. Several students had light bulb moments in which they literally exclaimed “OH! THAT’S WHY I’M DOING THAT!” One program coordinator finally understood why she hates January a lot more than July.
Then, once the staff was on the same page, I grabbed our director – she made some corrections and then I asked her to change it to her dream scenario and she changed some things around.
Design points illustrated in this story:
- The sticky notes are qualitatively different than the whiteboard in the previous example; sticky notes can be made and then saved to the side if you don’t know where they belong yet. There were several instances in which a student knew there was an event that needed to occur but couldn’t tell me exactly when – I had to wait for the program coordinator to contribute to get it right. There are times when not having to erase things can be helpful.
- By having a concrete visualization, you can have an asynchronous conversation, deciding where and when you bring people to the meeting post. By having the students contribute, then the coordinators, then the director, we were able to unveil and correct some misconceptions; everyone was able to pick up on any logistical problems, and the director was able to set new goals in a public and documented fashion.

Pathfinding. Finally, visualization support reflective practice. I’m not going to go too far into defining reflective practice, because I think you already know what it is. But here’s a visualization if you need one.
Reflective practice is an intentional process in which you look back at events, ask questions about what could have gone better, evaluate your performance, and then make changes so that you can continue to improve. However, sometimes we need help identifying what needs to be fixed. One approach is critical incident analysis, which is also something I learned in medical practice although you’ll find it across disciplines. Briefly, a critical incident analysis is an approach to dealing with challenges in everyday practice. Reflective practitioners pose problems about their practice, refusing to accept ‘what is’. So they explore incidents which occur in day-to-day work in order to understand them better and find alternative ways of reacting and responding to them.

A fishbone diagram, also called a cause and effect diagram is a visualization tool for categorizing the potential causes of a problem in order to identify causes. The basic idea is to have your team identify and create a problem statement and then brainstorm on the major categories of things that could have contributed to the problem. Once you have your categories identified, you can focus on specific possibilities related to each category.

And finally, almost like a juicy postscript:

1. Content first
A visual is only as good as the content you present. Your impact is only as good as your documentation. Identify yourself. Cite your sources. Credit your artwork. Make it easy to check your work.
2. Tell a story with your designs
Write the story first, as you would for any article. Lay out your narrative or argument in a logical, compelling order. This infographic, for example, has the same components you would find in a newspaper or journal article.

3. Write in data paragraphs
Edward Tufte defines data paragraphs as a cohesive set of numbers, words, and graphics. Consider what each element is bringing to the understanding of the information. Graphics, just like words or numbers should never be randomly placed on a page.

4. Simplicity is discipline
In matters of design, more is rarely better. Directly label your information when possible (instead of using a key). Limit your color palettes to three to five colors. Limit your fonts to one or two fonts. Limit unnecessary punctuation.
5. Make a color palette & pre-select your fonts. It will save you time.


Featured Image: Isaac Benhesed on Unsplash


Reasons
I chose the apartment I’m renting this summer for all sorts of practical reasons:- it’s close to the students’ dorm. – it’s close to my mother’s place. – it’s on multiple metro lines. – shops and other amenities are accessible. – it is within budget. (<= super extra important) But if I’m completely honest, I …

California Sociological Association Conference 2016
After travelling all summer, starting my final semester at Berkeley City College and moving back to West Oakland, I found some time today to make this poster for the upcoming conference.
